Multiple factor DSEq2 result generates weird volcano plot
1
0
Entering edit mode
@e732b1f0
Last seen 11 months ago
United States

Hello Everyone,

I am working on a project with the goal of improving the prediction accuracy of melanoma relapse by combining the RNA signature with the clinical features.

Firstly, I calculated the asssociation/relationship between the clinical features with the outcome (early recurrence < 3yrs vs no relapse with at least 5 yrs follow up) and found that Tcat, mitosis and last_vitalstatus are closely related with the outcome result.

Secondly,I need to do the DGE by using the DESeq2 to extract a signature. During this process, I set the closely related clinical features as controls in the design to exclude their effect on the DGE result.

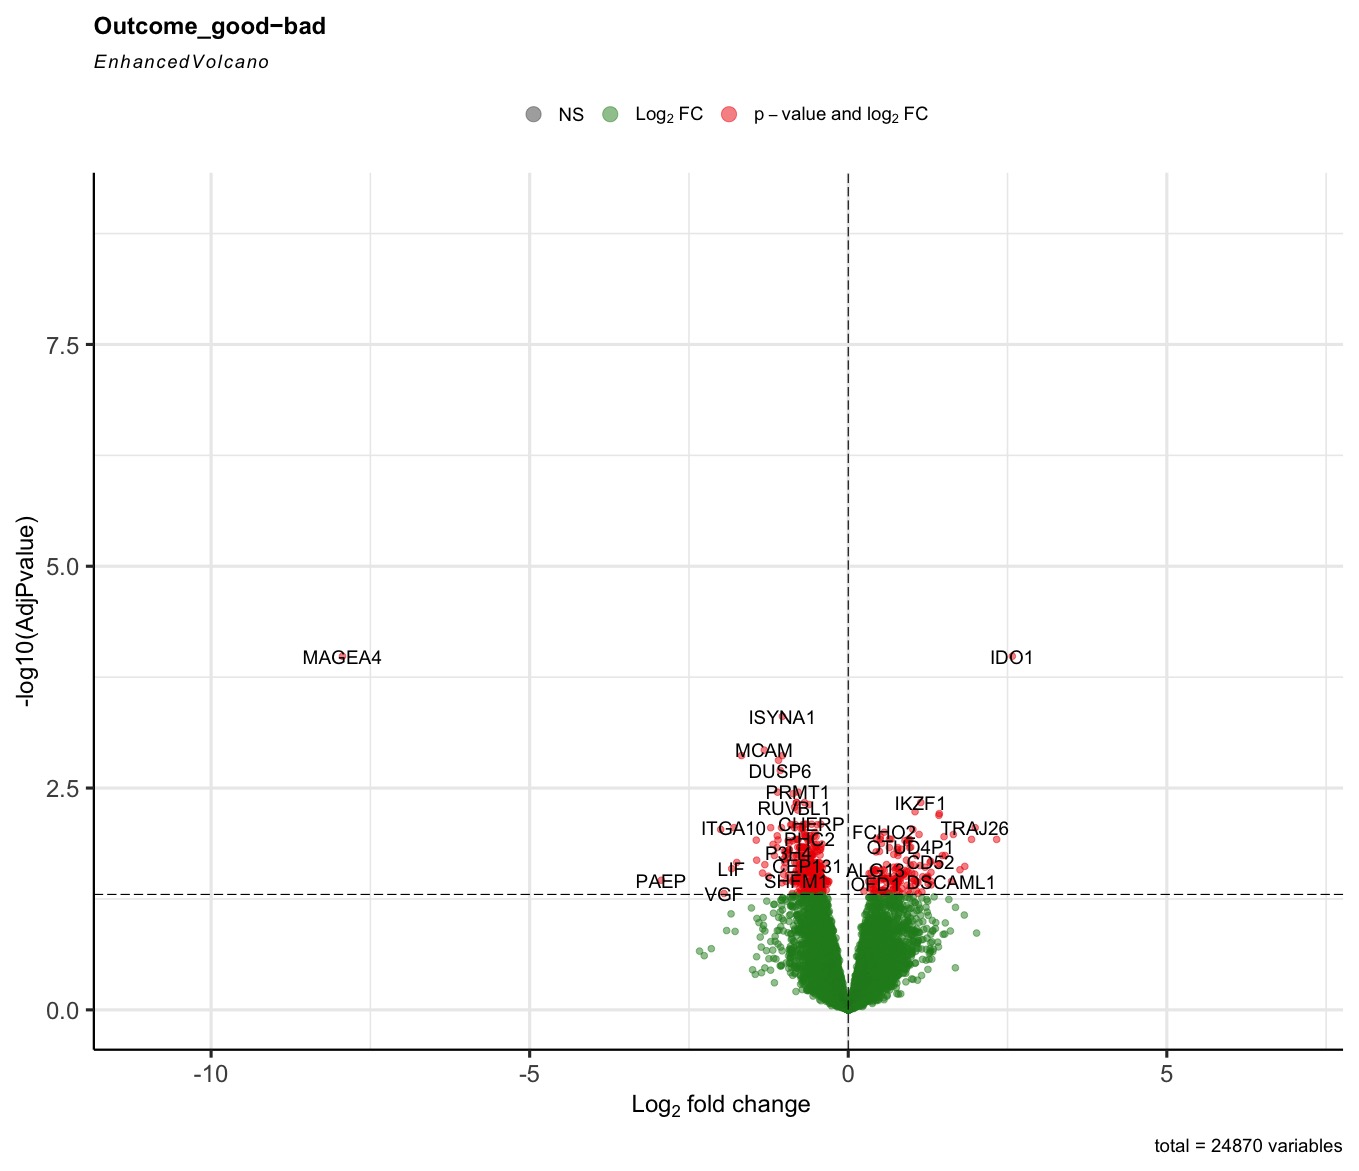
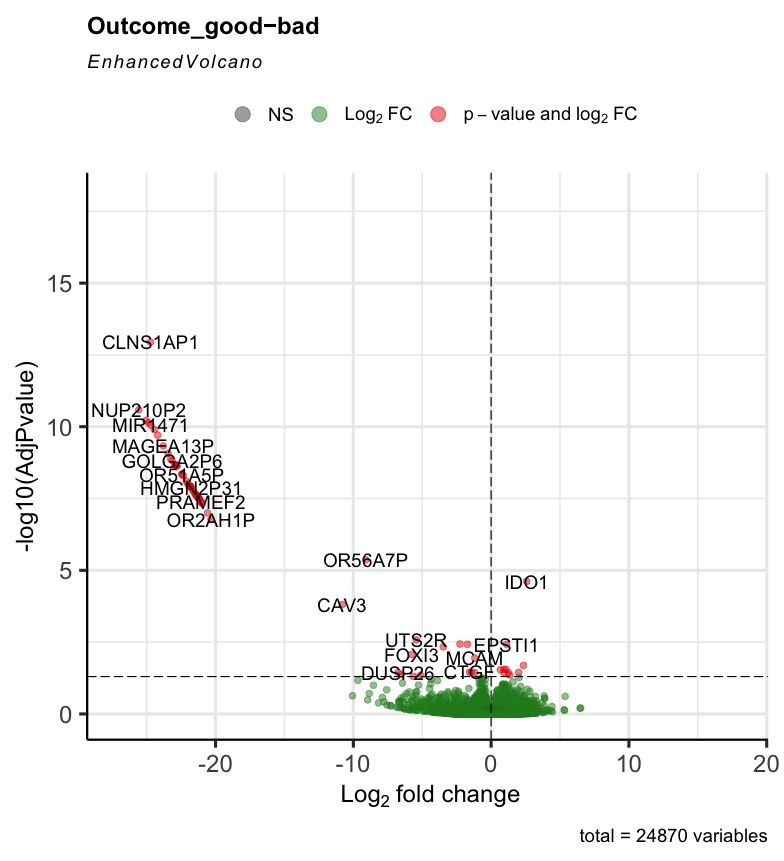
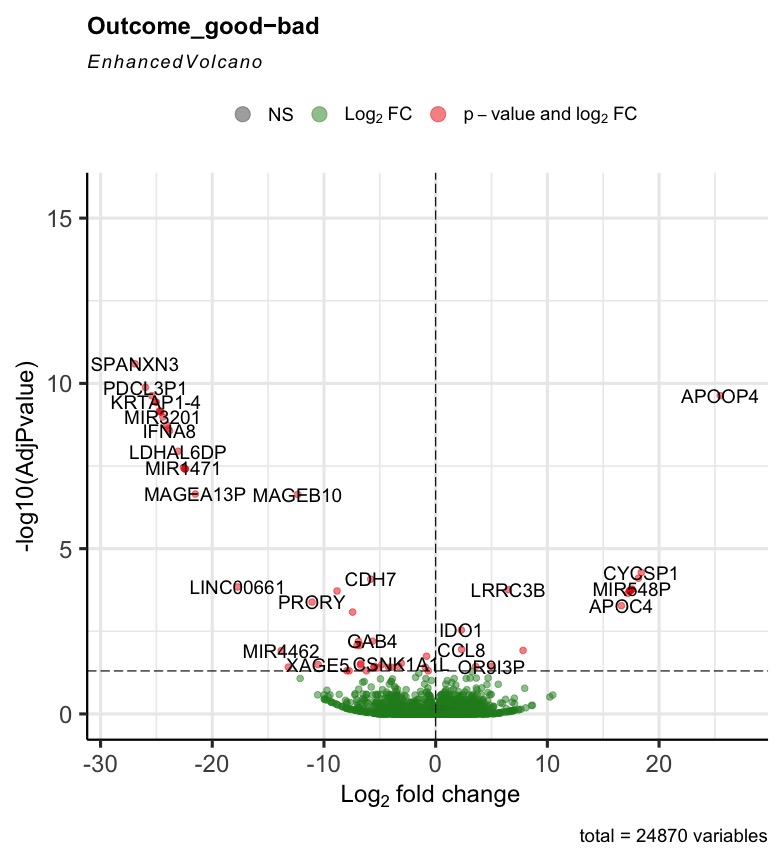
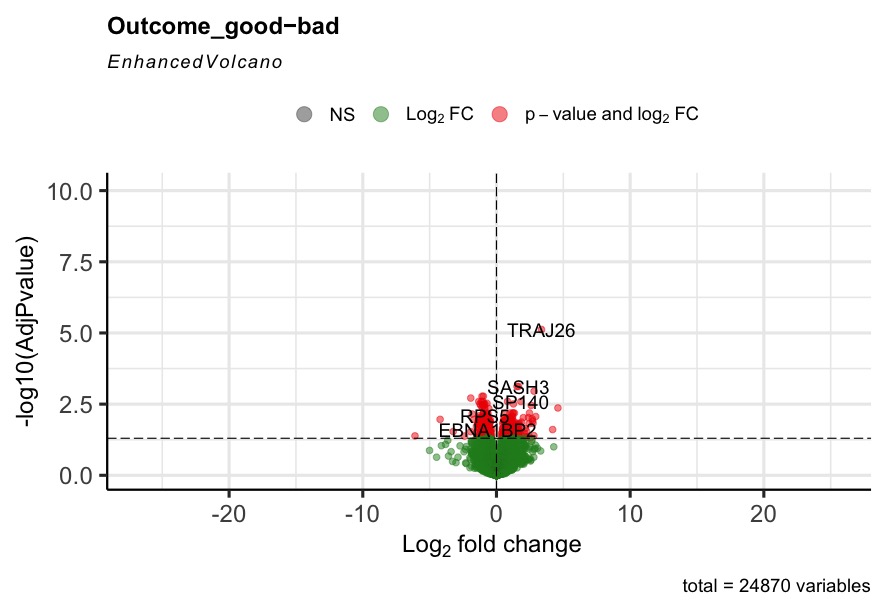
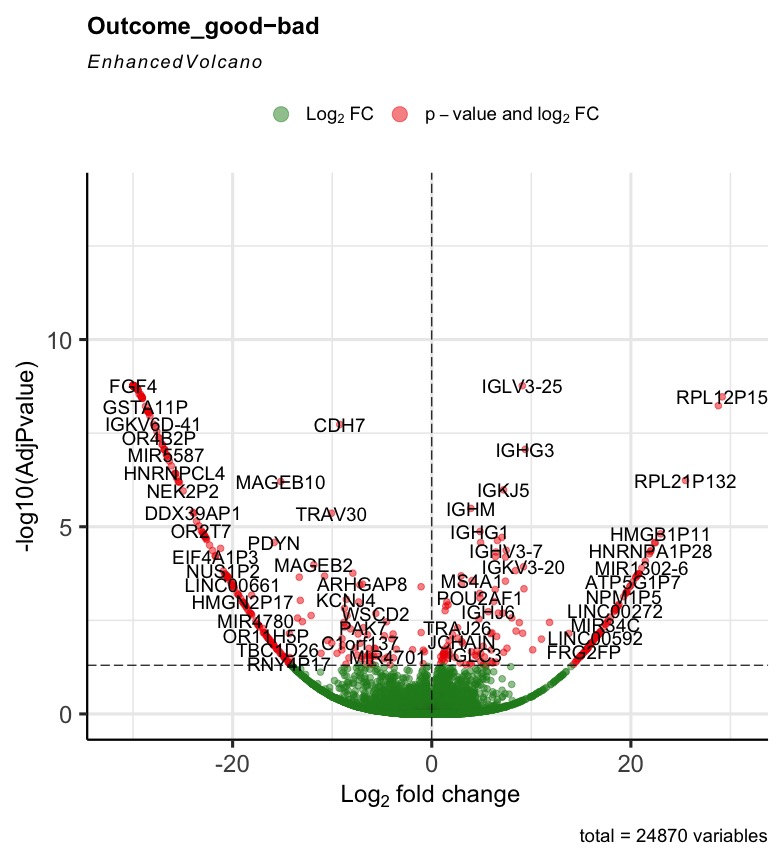
The R code can run successfully, but most of the generated volcano plot are weird when I consider some control factors. Only when I use the last_vitalstatus as control, the volcano plot looks normal (Fig3). The more control factors, the more stretched of the volcano plot, as presented by the last figure(VolcanoPlot_Mitoses_LastVitalStatus_Tcat_Ascontrol.jpeg). If I don't consider any control, the volcano plot is perfect, as presented by the Fig1 (VolcanoPlot_NoControl.jpeg).

The code is attached. I am very grateful, if someone can tell me if I did something wrong. As the Outcome is the feature that I am interested, so I put it at the end of the design.

<h6>#</h6>

dds <- DESeqDataSetFromMatrix(countData=RawCountMatrix, colData=EventControl, design= ~ mitoses+Last_vitalstatus+Tcat+Outcome_Grouping)

keep <- rowSums(counts(dds)) >= 10 dds <- dds[keep,]

dds <- DESeq(dds) res <- results(dds)

resOrdered <- res[order(res$padj),] write.csv(as.data.frame(resOrdered), file="Outcome_Good-Bad.csv")

enter image description here enter image description here enter image description here``` enter image description here enter image description here

DESeq2 • 1.5k views
ADD COMMENT
0
Entering edit mode

Prefiltering could help. Your filter only removes genes that are not expressed rather than genes with single or few high outliers or inconsistent detection. See the vignette on prefiltering or simply use filterByExpr from edgeR.

ADD REPLY
0
Entering edit mode

Thank you for your response. I will filter the data first to see what is the effect of expression outlier on the result. Once I get result, I will post it here.

Thanks again.

ADD REPLY
0
Entering edit mode
@mikelove
Last seen 12 hours ago
United States

I set the closely related clinical features as controls in the design to exclude their effect

This can be problematic if they are highly correlated.

Compute

cor( colData(dds)[,c("factor1","factor2",...)] )

To see if they are too closely related.

Otherwise it would be helpful to show PCA plots colored by your different variables.

ADD COMMENT
0
Entering edit mode

Hi Michael,

I appreciate your comments. Guidance and suggestions from an expert really save my time!

Actually, the three factors of Tcat, mitosis and last_vitalstatus are closely correlated with the outcome, with an adjust p-value of 0.0048,0.0114 and 0.0005, respectively. As we can see, among them, the last_vitalstatus has the closest relationship with outcome indicating by a smallest adjust p-value. But the volcanoplot with it as a control factor looks normal (Fig 3). I also tried other factors that are not related with outcome (with a p-value of 1), the acquired volcano plots looks normal too. So, it seems for factors which are very closely related or not related at all, the volcano plot looks good, but for the intermediate factors, the volcano plots look weird. Is my understanding correct?

Besides, how should we determine which factor should be used as control for the design matrix? Originally, I think because these three factors are closely correlated with outcome and their effect should be excluded from the DGE result by using them as factors. From the current result, if we use the closely correlated factor as control for DGE, the volcano plot looks bad. I am confused now. Should we use the closely related or non-related factors as control for DGE design?

Thanks in advance.

Yang

ADD REPLY

Login before adding your answer.

Traffic: 382 users visited in the last hour
Help About
FAQ
Access RSS
API
Stats

Use of this site constitutes acceptance of our User Agreement and Privacy Policy.

Powered by the version 2.3.6