I try to follow this vignettes to annotate the peak, but I have difficulty applying the code to my data. Would you have a suggestion on what I should run next after getting the table below? Thank you so much!
Hi Chris,
Thank you for trying ChIPpeakAnno to annotate your data.
If you are trying Nextflow nf-core/atacseq pipeline, you may want to try the code at https://github.com/jianhong/atacseq/blob/master/bin/diffbind.r which is similar to the nf-core pipeline.
Jianhong.
Do you think this looks like the correct output for annotatePeakInBatch() Would you please suggest a way to convert Ensembl ID to gene ID in this case?
The "prefix" in the row name supposes to the your peak id. You annotate each peak to its associated features, that is why they are displayed in pair separated by a period. You can add a Gene symbol column to your annotated peak with ChIPpeakAnno::addGeneIDs, try ?addGeneIDs to see examples.
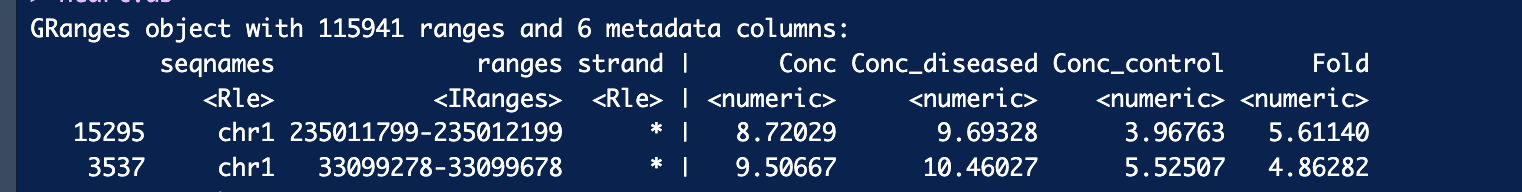
The "Fold" column belongs to your peak meta columns, it has nothing to do with ChIPpeakAnno, instead, it was generated by DiffBind, according to its manual:
The Fold column shows
the log fold changes (LFCs) between the two groups, as calculated by the DESeq2 analysis. DiffBind
Thank you so much! The Conc and Conc_diseased columns made me unsure about the Fold column. Hope the number of genes will not be too many when I filter out NA and keep only unique gene names.
The vignette you point to is meant to help a beginner learn how to use the software. The best suggestion is for you to read the vignette as many times as necessary for you to understand how to annotate your peaks. It's a step-by-step instruction, so that's what you should be reading.
You should almost never need to use system.file. It's meant to allow developers to put example data in their package that can then be used for vignettes or examples. What that line of code does is read an example bed file that the package author then uses for examples.
Your data will not be in the R package library directory (don't put anything in there), but instead should be in your working directory. You have a GRanges object that presumably you read in from your working directory. The idea behind a vignette is to provide an example that you can then emulate, so the expectation is that you will do something similar to what the vignette author did, but using your own data instead.
If you have only one GRanges object, what are gr1 and gr2?
Also, you seem to be doing things backwards. Usually people have a goal they are trying to accomplish and then they try to figure out how to accomplish it. I have no idea what you are trying to accomplish, or why. So if you want to know what peaks overlap in gr1 and gr2, then what you ask is a fine way to do that. But why do you want to know that?
Thank you for your reply. I use dba.report() from DiffBind to get the Grange object then I try to follow the vignette to annotate the result from DiffBind. Is that correct?
Again, you are either being mysterious about what you are trying to do, or you have no idea, and are just trying things. Neither is good. You cannot expect people to help you if you are unwilling to say what you are trying to do, and if you have no idea what you are trying to do, then this isn't the place either. Nobody can do a knowledge transfer over the intertubes, and it will be up to you to read things and try to understand as best you can. The nice thing about Open Source software is that you can just download and use it. But that's not to say it's free! It will cost you the time and effort required to get yourself up to speed and fully understanding what you are doing. That's not a trivial process, and nobody can help you. It's on you to read and understand. If you cannot do that, you need to find someone locally who does and have them either do the work for you or tutor you through it.
From what you have said, you have used DiffBind to find differentially bound peaks from a ChIP-Seq experiment (or so I assume). And now you want to annotate those peaks. ChIPpeakAnno is designed to annotate peaks from a ChIP-Seq experiment and has like three different vignettes that show how to do so, depending on what you are trying to do. If you are asking if you can use that package to do what it says it does, then yes! That's what it is designed to do!
You have a GRanges object that is not dissimilar to what they use in the vignettes (they start with a GRanges object as well). And they show, step by step, how to use a GRanges object to annotate. You will have to follow along, using your data, and the correct TxDb object. If you get jammed up and have a specific question about a specific problem, then please post a question.
Yes, I have ATAC seq data from 2 samples (diseased and healthy). I ran Nextflow ATAC pipeline and got the output files (including bams and broad peaks files). I used these output files as input for DiffBind. DiffBind then created the Grange object that I show here. The vignette has gf1 and gf2, and used bed and gff file as input which I haven't understood to follow yet because I don't have these files. Do I need to convert my data into gff and bed files? Thank you!


Hi Jianhong, thank you so much for sharing!
Hi Jianhong,
Do you think this looks like the correct output for
annotatePeakInBatch()Would you please suggest a way to convert Ensembl ID to gene ID in this case?The row name has a prefix so it is not Ensembl ID to apply the code above.
Thank you so much.
The "prefix" in the row name supposes to the your peak id. You annotate each peak to its associated features, that is why they are displayed in pair separated by a period. You can add a Gene symbol column to your annotated peak with
ChIPpeakAnno::addGeneIDs, try?addGeneIDsto see examples.Thank you so much for your suggestion! It worked. Would you tell me how to interpret the fold in this case?
The "Fold" column belongs to your peak meta columns, it has nothing to do with
ChIPpeakAnno, instead, it was generated byDiffBind, according to its manual:Thank you so much! The Conc and Conc_diseased columns made me unsure about the Fold column. Hope the number of genes will not be too many when I filter out NA and keep only unique gene names.