Entering edit mode

Hello everyone,
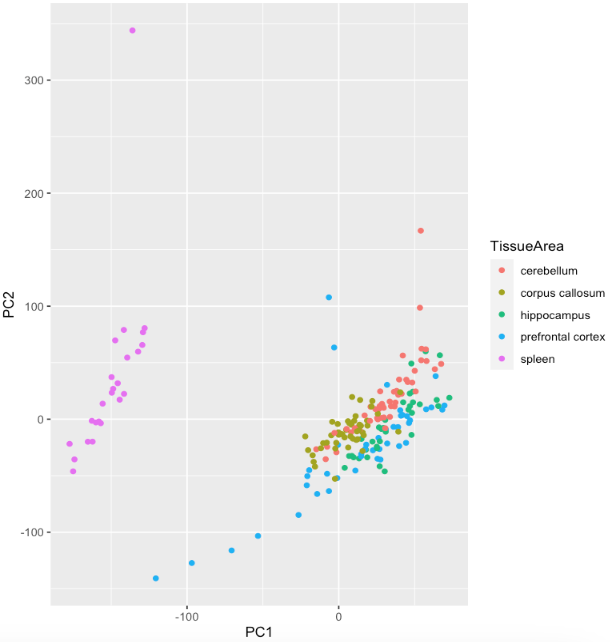
I use the following code to plot PCA:
tpm <- (assays(se)$abundance[apply(assays(se)$abundance, MARGIN = 1, FUN = function(x) sd(x) != 0),])
logtpm <- log2(tpm + 1)
tpm_centered <- t(logtpm-rowMeans(logtpm))
pca <- prcomp(tpm_centered , scale=TRUE, center=TRUE)
pca_df <- data.frame(pca$x, colData(se))
ggplot(pca_df, aes(x = PC1, y = PC2, color = TissueArea)) +
  geom_point() +
  labs(x = "PC1", y = "PC2", color = "TissueArea")
But I do not know how to label the outliers and also I do not know what is the criterial for outliers. Do you have any experience or tutorial to share? Many thanks!