
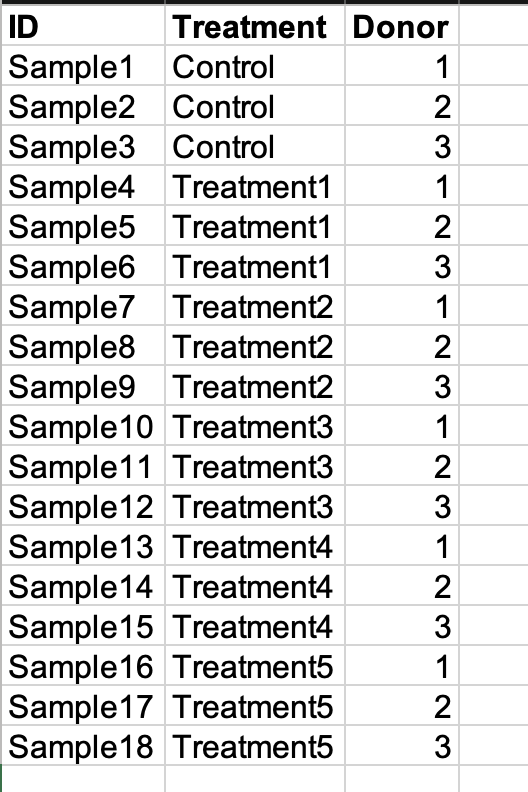
I want to do differential gene analyses between the following groups (each with three donors).
Control, Treatment 1, Treatment 2, Treatment 3, Treatment 4, Treatment 5.
The goal is to identify DEGs between each treatment and the control. I initially built the dds object with the raw counts from all groups and then specified the pairwise comparisons of interest. However, I soon realized that the number of DEGs for each pairwise comparison is greatly influenced by whether I construct the DESeq2 model with all the data or a subset of groups that are then compared. For some comparisons, building the model with all the data seems to improves the power, whereas other comparisons benefit from first subsetting the specific groups and then building the model.
For example, if I subset the data corresponding to control, treatment 1, and treatment 2, construct the dds model, and then specify the pairwise comparisons, there are 280 and 2,193 DEGS for treatment 1 and treatment 2 relative to the control. However, the number of DEGs is reduced to 66 and 125 if I construct the model with all the data and then specify the same comparisons.
This scenario is flipped for other treatments (e.g there are more DEGs when constructing the model with all the data compared to subsetting first).
I am curious what is the best way to approach this problem. Thanks!


Hi Mike, I have posted the PCA plots.
It is interesting. If I subset the untreated samples with single treatments B, Z, or G, PCA1 is explained by the donor, while PCA2 is influenced by the specific treatment. I have routinely seen this before in other experiments with these cells. However, the variance for the dual treatments (BZ or BG; where BZ indicates treatment with both B and Z) is explained predominantly by the treatment rather than the donor especially for BG.
I noticed that donor 2 (treatment 3) in the bottom left plot is far away from all other samples. This is also reflected in the PCA plot with all samples. I wonder if this sample is increasing the variance of the dataset and thus reducing the power for some comparisons.
I am curious what you think is the best approach for this. Thanks!
I have set up the design for the dds object accordingly:
What is the relationship btwn donor X across treatments? Is donor 1 in treatment 1 the same as donor 1 in treatment 2?
Yes. d1, d2, and d3 are the same donors across all treatments.
Looking at the PCA, it seems like in the top row, treatment effect >> donor effect or variability, so those would benefit the most by subsetting. The bottom row BZ and BG have more substantial variability. I would recommend subsetting for all the comparisons on this dataset, to avoid losing power on the treatments with strong effects. BZ and/or BG may require more replicates to assess the effect of treatment.
Thanks a bunch, Mike! I agree. I will subset for all comparisons.