Choosing between VST and rlog for PCA for outlier identification in DESeq2 when small number of samples
1
0
Entering edit mode
@5aed2cd4
Last seen 9 months ago
United Kingdom

I am looking at differential genes between disease cases and controls (35 sample in total). I ran DESEQ2 with the raw counts of protein coding genes from my total RNA sequencing experiment to identify my DEGs.

I understand that when doing PCA, its better to transform the normalized data to the log2 scale, either rlog and vst.

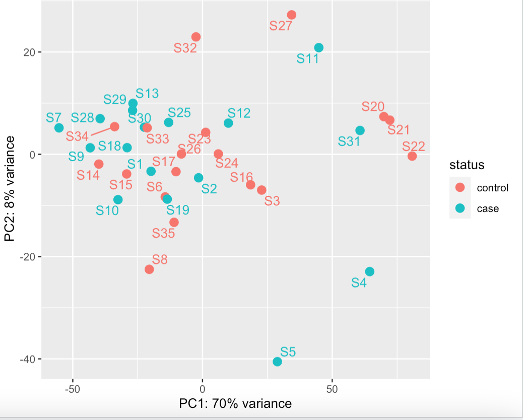
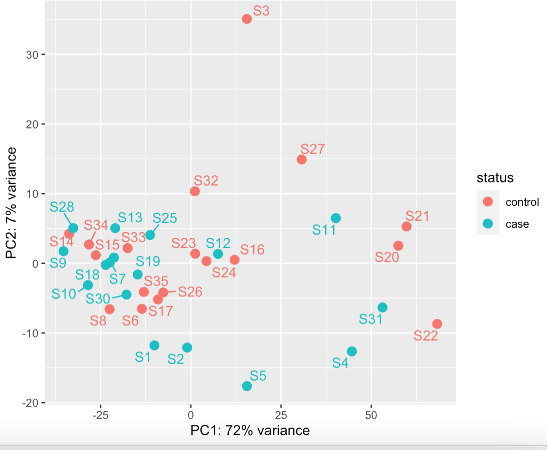
Doing this, I get two slightly different PCAs


rld <- rlogTransformation(dds, blind=FALSE)
plotPCA(rld, intgroup="status")
vsd <- vst(dds, blind=FALSE)

pcaData <- plotPCA(vsd, intgroup=c("status"), returnData=TRUE)
percentVar <- round(100 * attr(pcaData, "percentVar"))
ggplot(pcaData, aes(PC1, PC2, color=status)) +
  geom_point(size=3) +
  xlab(paste0("PC1: ",percentVar[1],"% variance")) +
  ylab(paste0("PC2: ",percentVar[2],"% variance")) + 
  geom_text_repel(aes(label=ss$sample), show.legend = FALSE)
  coord_fixed()

No clear outlier of S3 (or other samples) using this method (VST) PCA using vst


rld <- rlogTransformation(dds, blind=FALSE)

pcaData <- plotPCA(rld, intgroup=c("status"), returnData=TRUE)
percentVar <- round(100 * attr(pcaData, "percentVar"))
ggplot(pcaData, aes(PC1, PC2, color=status)) +
  geom_point(size=3) +
  xlab(paste0("PC1: ",percentVar[1],"% variance")) +
  ylab(paste0("PC2: ",percentVar[2],"% variance")) + 
  # geom_text_repel(aes(label=ss$sample), show.legend = FALSE)
  coord_fixed()

This still shows potentially S3 might be an outlier (rlog)

PCA using rlog

My question is which transformation to use (vst or rlog)?

Generally, the literature and bioconductor suggests going for vst when you are looking for outlier identification. However, DESeq2 also suggests going for rlog rather than when you have small number of samples (>30) and vST for large datasets (hundreds of samples). I have 35.

These decisions will ultimately affect whether I exclude S3 or not, which will affect downstream data analysis for e.g. the number of DEGs. (If I exclude S3, I get 9 DEGS, rather than 21)

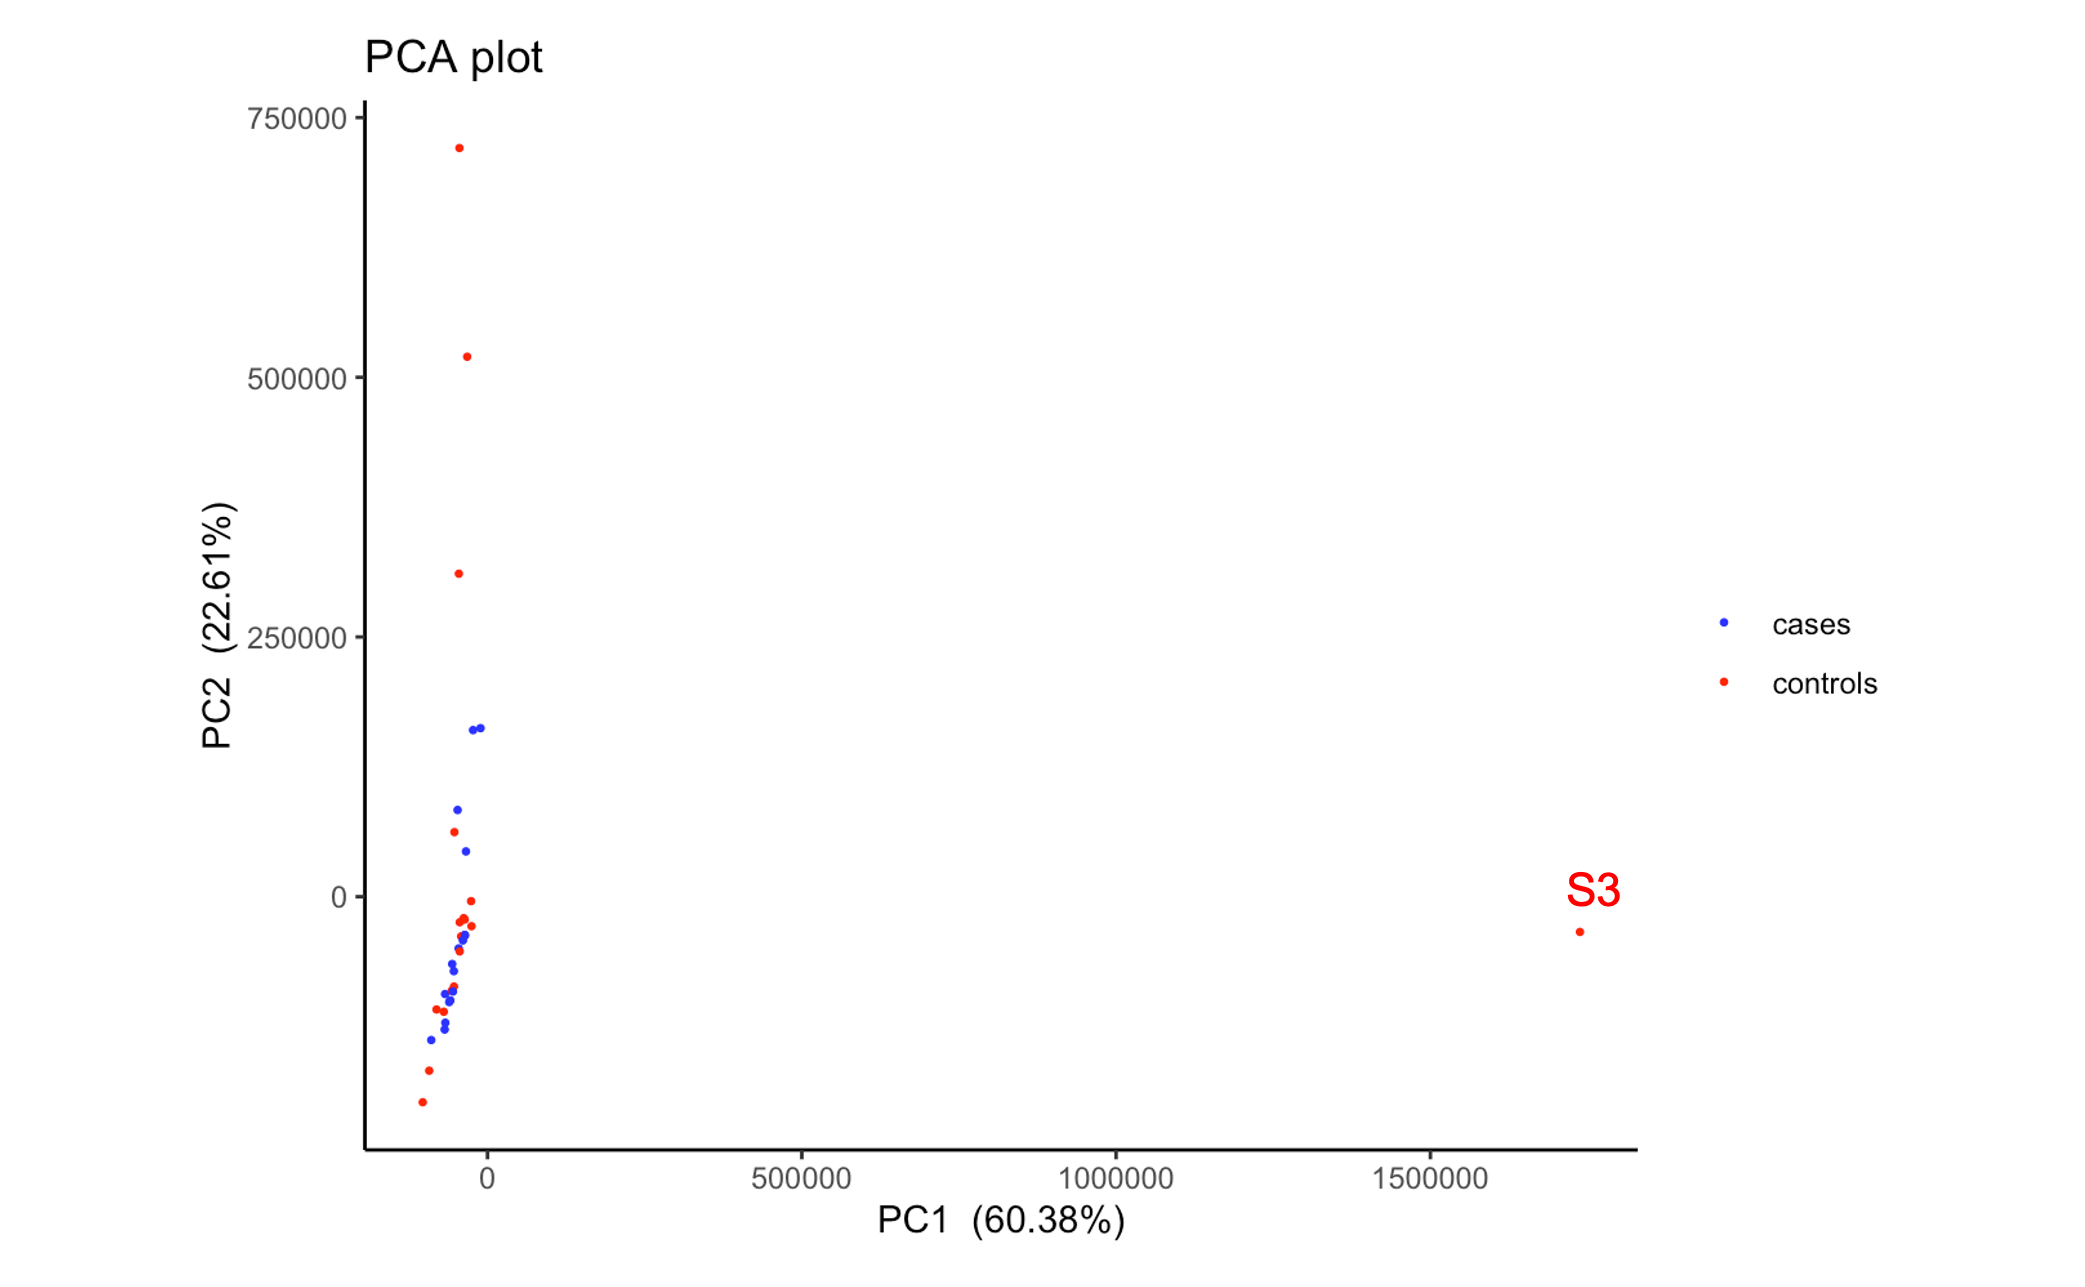
As of note, if I run a PCA on the normalised (untransformed) expression matrix from DESeq2, S3 is a very clear outlier

normalised but untransformed PCA

Thank you so much.

DESeq2 • 1.5k views
ADD COMMENT
0
Entering edit mode

What both plots show is that there is notable separation along PC1 irrespective of group. That would be the main source of unwanted variation I would tackle, and not that one single outlier. You can use something like RUVseq (see vignette and the DESeq2 workflow at Bioconductor) to estimate factors of unwanted variation and include that into the design.

ADD REPLY
0
Entering edit mode

Thanks I will look into this

ADD REPLY
0
Entering edit mode
@james-w-macdonald-5106
Last seen 5 days ago
United States

In your second PCA plot, the vertical axis accounts for 7% of the total variance, whereas the horizontal axis accounts for 72%. You have noted that S3 looks like an outlier to you, but in the vst plot S5 is comparably distant from the rest of the samples as well. I don't see much to be concerned about, and my default is to retain samples rather than remove.

Also, using raw counts for PCA (your last plot) isn't a valid thing to do, so I would ignore that plot entirely.

ADD COMMENT
0
Entering edit mode

Thanks a lot for this fast response James- Good point re. S3 and seems best to not remove S3.

Regarding the last plot, this is actually using the normalised counts (not the raw counts), but it is true that they have not been transformed like plot 1 or 2 and should not be used for PCA.

Do you have any strong indications to go for VST or rlog though? I would go for VST for outlier identification, even though I don't have 100s of samples. Does that seem ok to you?

ADD REPLY
1
Entering edit mode

I am not sure it really matters much. I generally just use logCPM for PCA, but then I don't use PCA for outlier identification. Instead I use it to identify unexpected patterns in the data, which might indicate sample mixups or batch effects that my clients forgot to tell me about (or as ATpoint mentioned, the need to account for surrogate variables, although I generally use p-value histograms to look for disinflation as an indicator for that). I mostly use limma/edgeR rather than DESeq2, and if I thought I had one or more outliers I would just use the limma-voom pipeline and incorporate sample weights to account for the outlier(s) without having to resort to sample exclusion.

In my experience, sample exclusion is a bit of a rabbit hole. You exclude one sample and then do a PCA, and what do you know? There's another outlier! Rinse/repeat all the way down to one sample, and you've fixed it! ;-D

ADD REPLY
0
Entering edit mode

Indeed, voomWithQualityWeights() or limma-trend with arrayWeights() makes outlier handling easy, I use this a lot recently for exactly the issue with removal as you mention.

ADD REPLY

Login before adding your answer.

Traffic: 498 users visited in the last hour
Help About
FAQ
Access RSS
API
Stats

Use of this site constitutes acceptance of our User Agreement and Privacy Policy.

Powered by the version 2.3.6