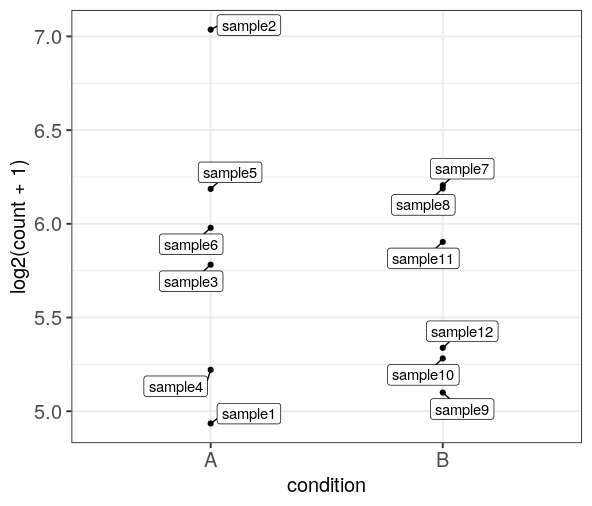
plotCounts label each sample
2
0
Entering edit mode
claire • 0
@2a044aa5
Last seen 5 months ago
United Kingdom

I'm using plotCounts(ddsM14.5, gene = "Bmp7", intgroup=c("Region")) to find expression of Bmp7 in each sample. I have 3 repeats for each region and I want to identify which sample the outlier is from. Can I colour or label the point by the colname?

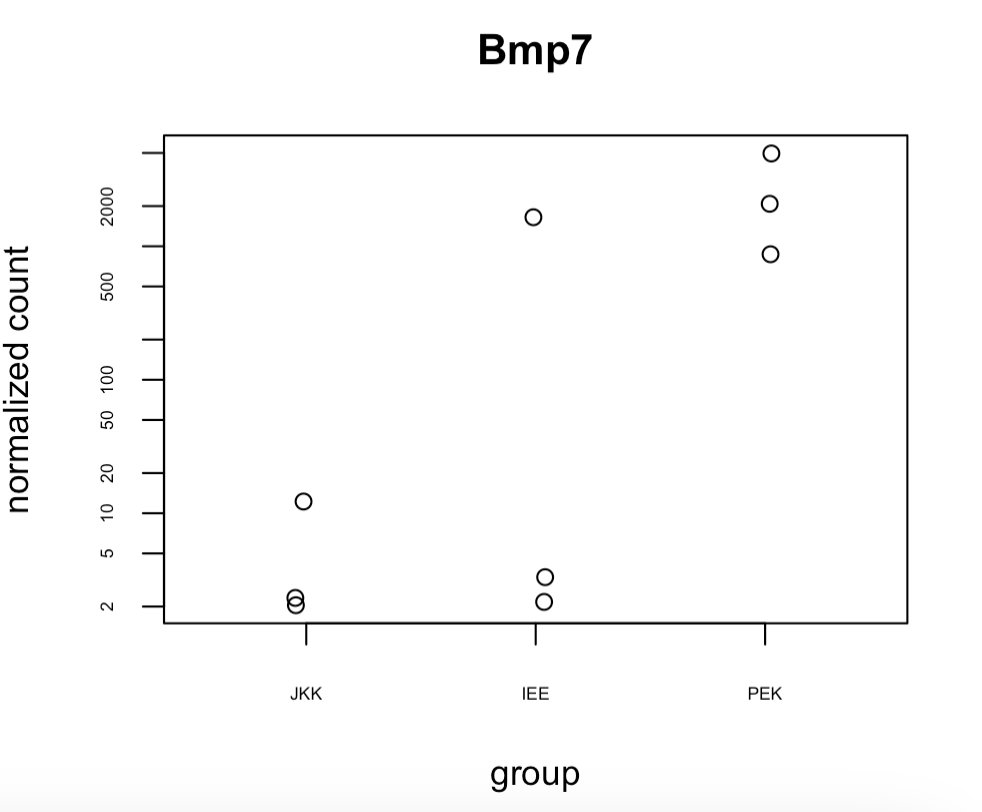
enter image description here

p DESeq2 • 476 views
ADD COMMENT
0
Entering edit mode
Basti ▴ 780
@7d45153c
Last seen 3 days ago
France

You could use ggplot2 (you do not provided data so I cannot test) :

plot = plotCounts(ddsM14.5, gene = "Bmp7", intgroup=c("Region"))

ggplot(plot, aes(x = Region, y = count, color = Region)) + 
  geom_point()
ADD COMMENT
0
Entering edit mode
ATpoint ★ 4.1k
@atpoint-13662
Last seen 6 minutes ago
Germany

You can return the data (rather than extracting manually from dds which is not difficult though) and then do ggplot "magic":

library(DESeq2)
library(ggplot2)
library(ggrepel)

dds <- makeExampleDESeqDataSet()
dds <- estimateSizeFactors(dds)

data <- plotCounts(dds, gene = "gene1", intgroup=c("condition"), returnData=TRUE)
data$sample <- rownames(data)

# Here using log2 of the counts, many options in ggplot to do axis scaling in case span of counts is large, please take a ggplot tutorial
ggplot(data=data, aes(x=condition, y=log2(count+1), label=sample)) +
  geom_point() +
  geom_label_repel(min.segment.length=0, max.overlaps=Inf)

enter image description here

ADD COMMENT

Login before adding your answer.

Traffic: 763 users visited in the last hour
Help About
FAQ
Access RSS
API
Stats

Use of this site constitutes acceptance of our User Agreement and Privacy Policy.

Powered by the version 2.3.6