I have a single cell dataset with two groups of cell types, where each group comprises 900 cells. I am confused what to set for large.n in the filterByExpr function. I couldnt understand the documentation. May you help me here?
I am the author of the filterByExpr() function, but I don't generally use it for scRNA-seq. My experience is mainly with 10X scRNA-seq, and I usually specify the minimum number of cells that I want a gene to be detected in. For example, I might decide that I want a gene to be detected in at least 100 cells to be kept in the analysis, so I would apply a filter like:
keep <- rowSums(exp_matrix > 0) >= 100
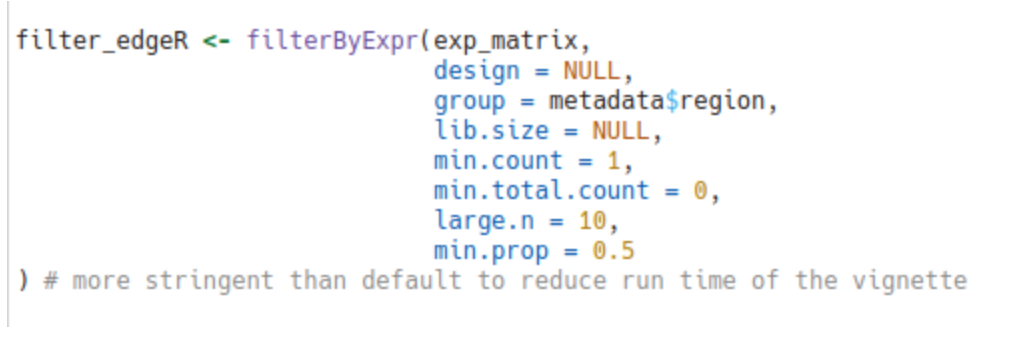
You could perhaps use filterByExpr() to get similar results. In any case, the large.n parameter is not very important in the single-cell context. With such large group sizes it doesn't matter what large.n is set to as long as it is very small compared to the number of cells in the smallest group. You can leave it as is, or reduce it to 0 or 1. Either way, it will make little difference. To understand this is more detail, suppose that the smallest group in your data contains 900 cells. If you set min.prop=0.5 and large.n=0 then you are requiring a cell to be expressed in at least min.prop * 900 = 450 cells. If you set min.prop=0.5 and large.n=10 then you are requiring a cell to be expressed in 10 + 0.5*(900-10) = 455 cells. It is hard to see how that could be a dramatic difference.
You use of min.prop=0.5 seems higher than most people would use for single-cell data. If your group sizes are all 900 or more, then that requires a gene to be expressed in >450 cells, which seems a lot.
You might reduce min.prop to 0.25 say, which would then be similar to the Nature Methods paper that ATpoint cites.
I said that reducing large.n would make little difference, and that is mathematically true because your group sizes are so much larger than large.n.
I did not say that reducing min.prop would make no difference. Quite the opposite, I suggested the change because it would make a difference.
How exactly have you determined that the number of false discoveries has increased? When analysing real data, we generally do not know for certain what is a true or false discovery.
Previous work (https://www.nature.com/articles/nmeth.4612) indeed showed that differential expression on single-cell level can be improved by reasonable prefiltering. What the authors did in this preprint was to retain only genes with 1 TPM in > 25% of cells in at least one of the two contrasted groups. What you could do is to calculate CPMs (rather than TPMs), for example scran::calculateCPM and then explore impact of different thresholds, rather than using filterByExpr, which has reasonable defaults, but for bulk rather than scRNA-seq.


are you sure that it will make little difference? the number of false positives increases tremendously after reducing it to 1 and min.prop to 0.25.
I said that reducing
large.nwould make little difference, and that is mathematically true because your group sizes are so much larger thanlarge.n.I did not say that reducing
min.propwould make no difference. Quite the opposite, I suggested the change because it would make a difference.How exactly have you determined that the number of false discoveries has increased? When analysing real data, we generally do not know for certain what is a true or false discovery.
Hi, Big thanks! now the bigger picture is clear to me.
I have labels, because i am working with a simulated dataset.