Two EPIC Methylation Array Analysis Questions
1
0
Entering edit mode
phelankj • 0
@c526a81b
Last seen 7 months ago
United States

Hello,

I had two questions regarding EPIC methylation array data analysis. I am using the minfi package for analysis, have removed low quality samples, processed the data with quantile normalization, and extracted both beta and m values.

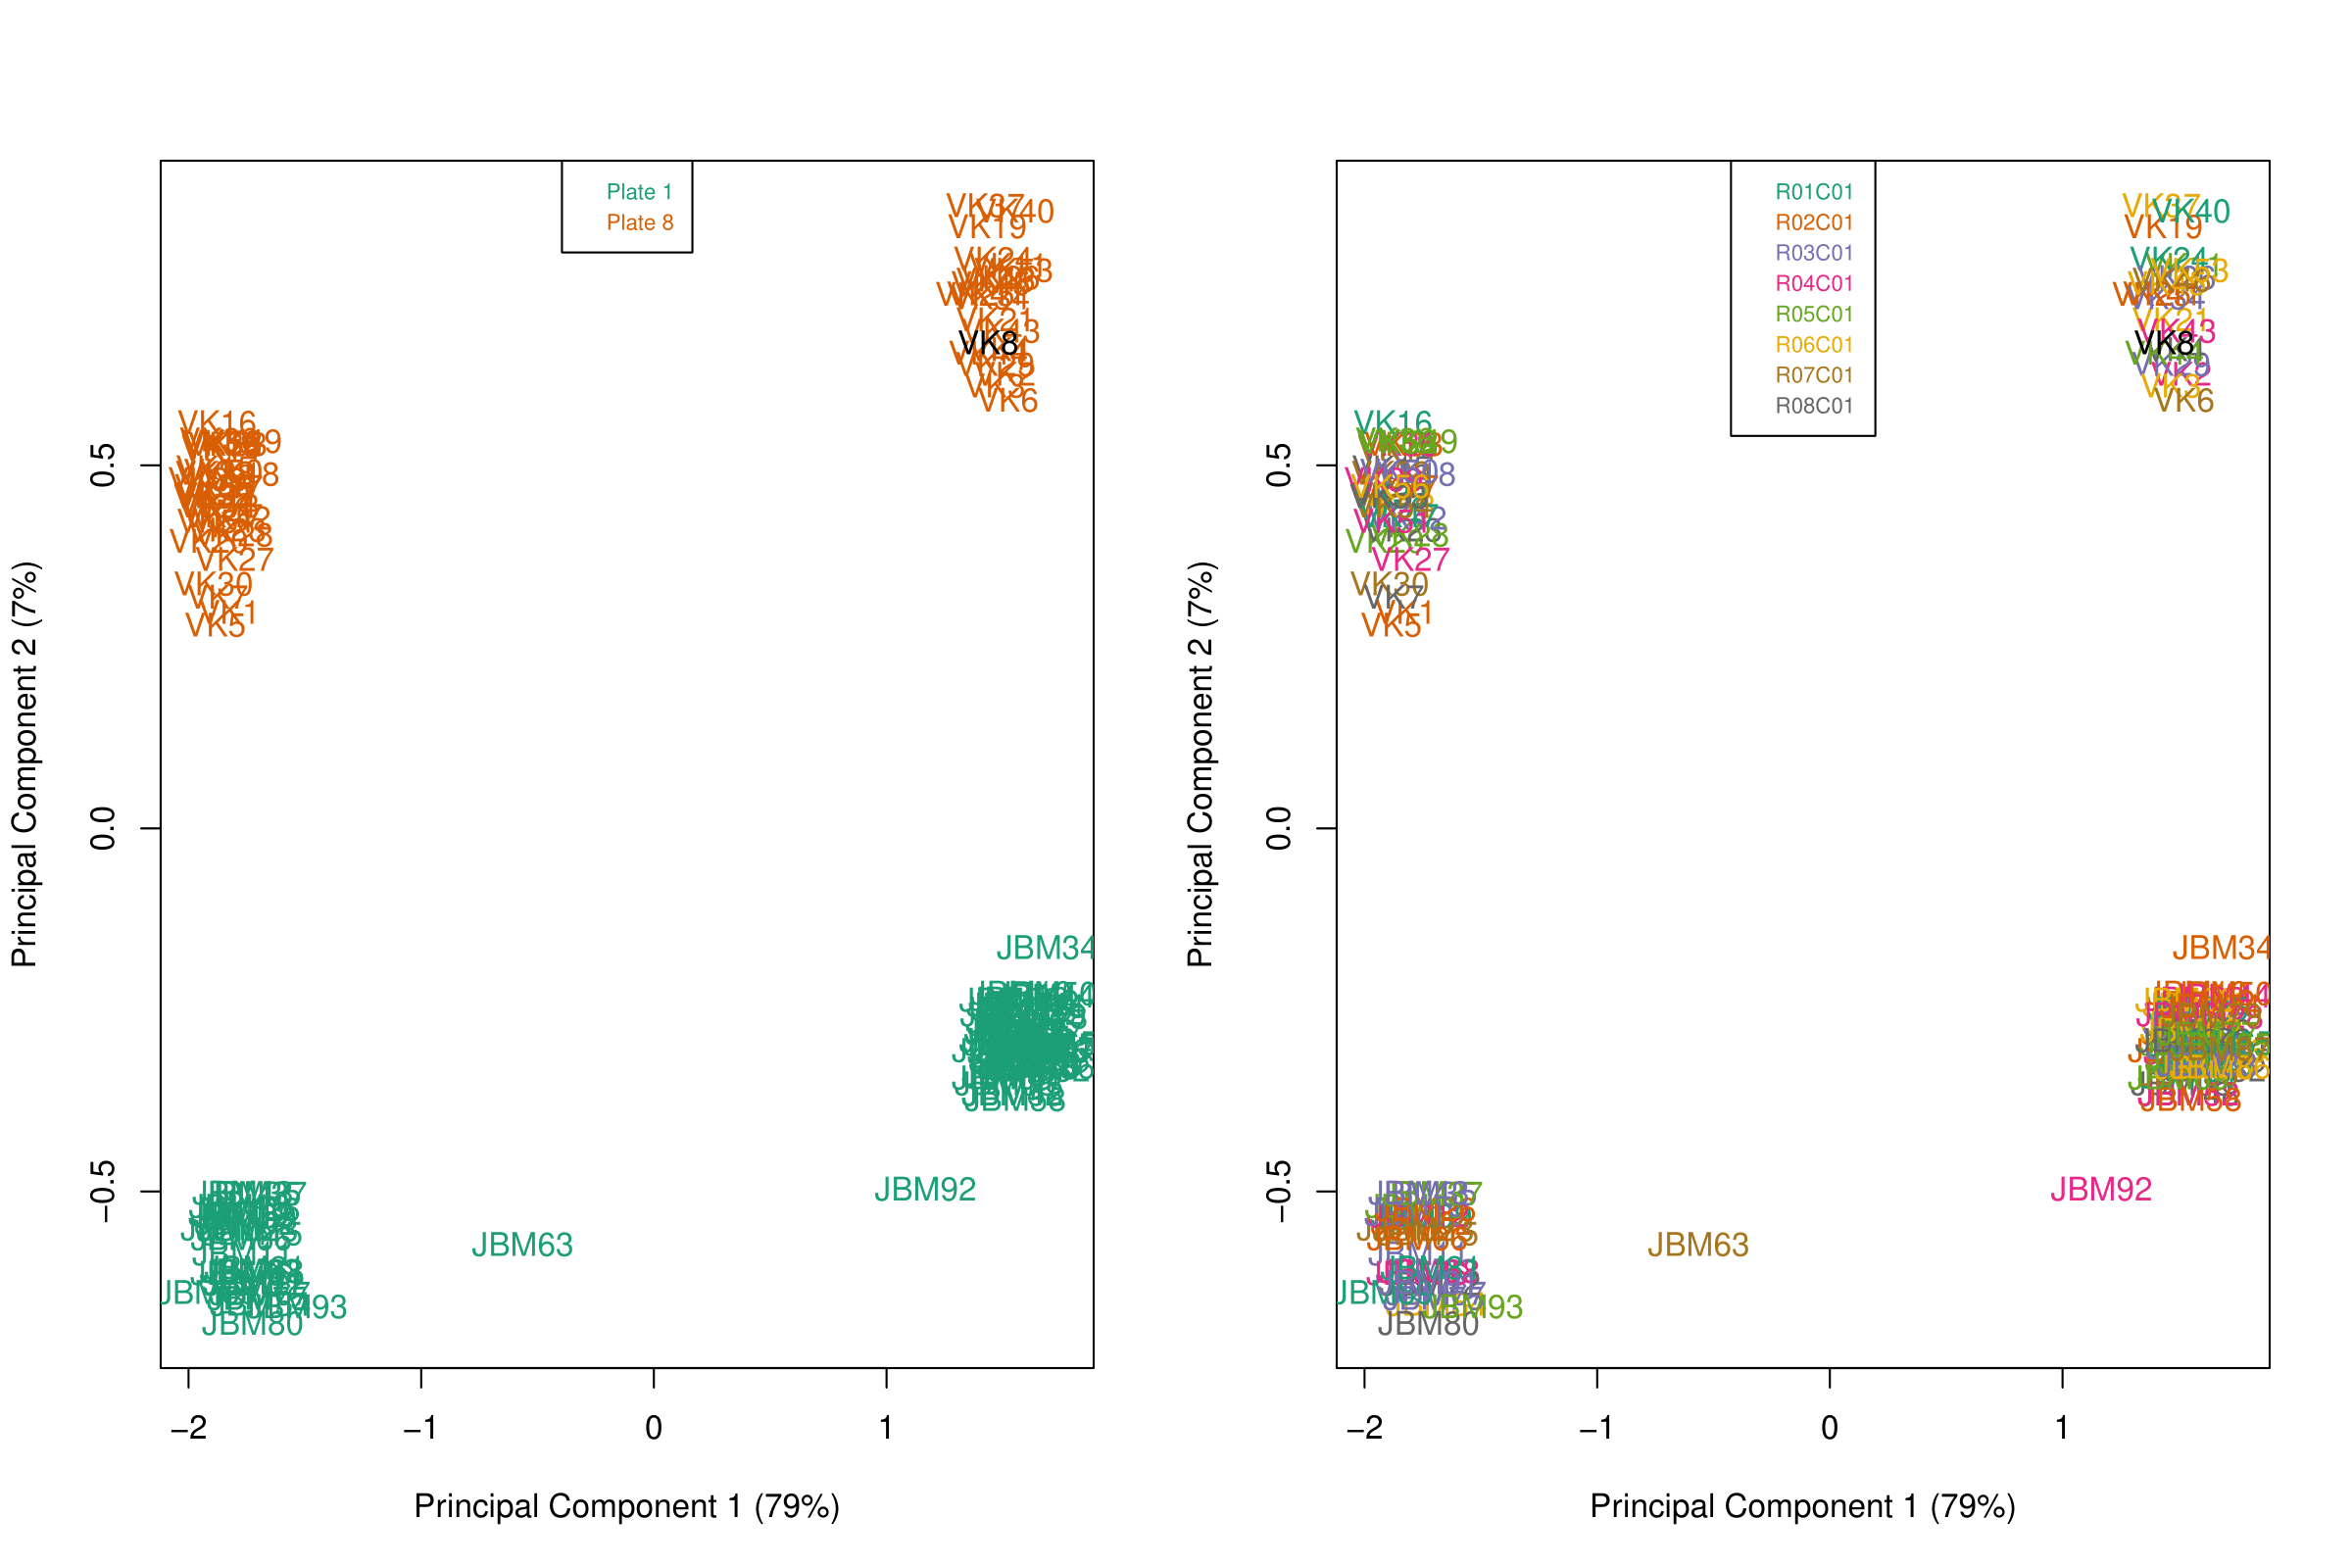
  1. When examining MDS (or PCA) plots to examine sources of variation in the data, I see a large batch effect along PC2 corresponding to the plate in which the sample was sequenced, which I expected. However, there is a large unexplained difference between samples along the first principal component which is present in both plates. It does not correlate with position on the chip, and it does not have an association with age, sex, race, or biological condition. It accounts for a huge amount of variance (79%), so I was wondering if there are any common technical issues that people adjust for on the front end or if anyone has seen this discrepancy before.

enter image description here

  1. Is linear regression (as in limma package) an appropriate model to use to determine differentially methylated CpGs/regions? The beta and M values have bimodal distributions which violates the normality assumption, I wasn't sure if another transformation was needed in order to achieve a normal distribution.

Thank you in advance for the help.

minfiDataEPIC minfi • 387 views
ADD COMMENT
0
Entering edit mode
@james-w-macdonald-5106
Last seen 1 day ago
United States

It's common to use limma to compare samples using the M-values. The distribution you are talking about is between-CpG distribution on an array, which is orthogonal to the distribution you care about. In other words, consider that your data are CpGs in rows, and samples in columns. The bimodal distribution is what you get when you plot the distribution of the columns. But the comparisons you will be making are the rows (e.g., you compare the same CpG in different samples, not different CpGs in the same sample).

As for the PCA, you don't have a large effect due to batch - it's only 7%. But you have a massive effect (almost 80% of the variation!) that you cannot explain? That's suboptimal. But then I don't use quantile normalization. You might try preprocessFunnorm, which is my personal go-to for methylation arrays.

Login before adding your answer.

Traffic: 473 users visited in the last hour
Help About
FAQ
Access RSS
API
Stats

Use of this site constitutes acceptance of our User Agreement and Privacy Policy.

Powered by the version 2.3.6