
Hi Everyone
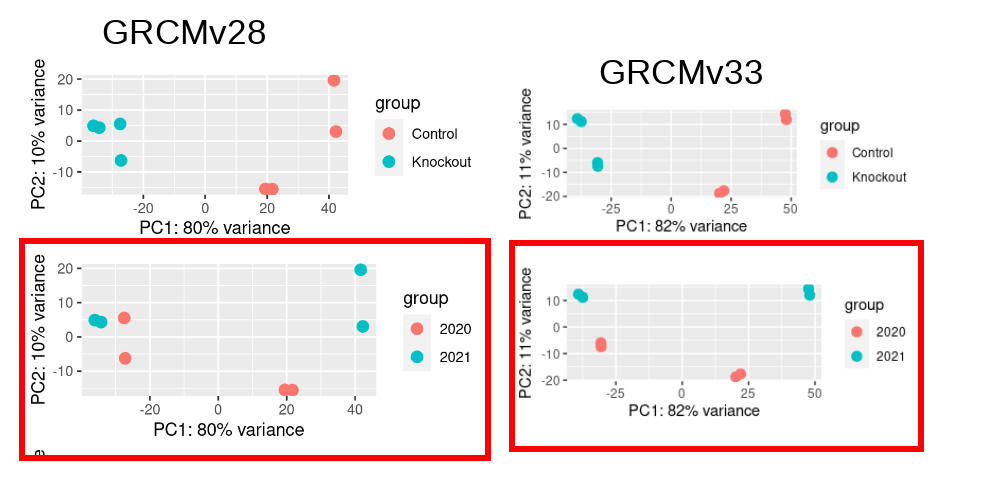
I have a mouse RNASeq data (Control vs Knockout) and I analysed last year using GRCM28 (See PCA Plot2). The samples segregate clearly by Condition and there is no clear segregation by Year. I repeated the same pipeline this year with only variable of reference genome (GRCMv33).This time I see clear segregation of same samples with 11% variance being explained by PC2. So I decided to account for this batch effect due to Year of sequencing in my design formula: design = ~ year + condition However, this reduces my DEGs drastically to 14 (out of ~18K genes expressed) (see the volcano plots made using ggvolcano)
My question is, should I perform batch correction or not because more than 80% of the variance in the dataset is being explained by my condition. If yes, how can I prevent this weird behavior and explore the reason behind such behavior? Any exploratory suggestion is appreciated!!
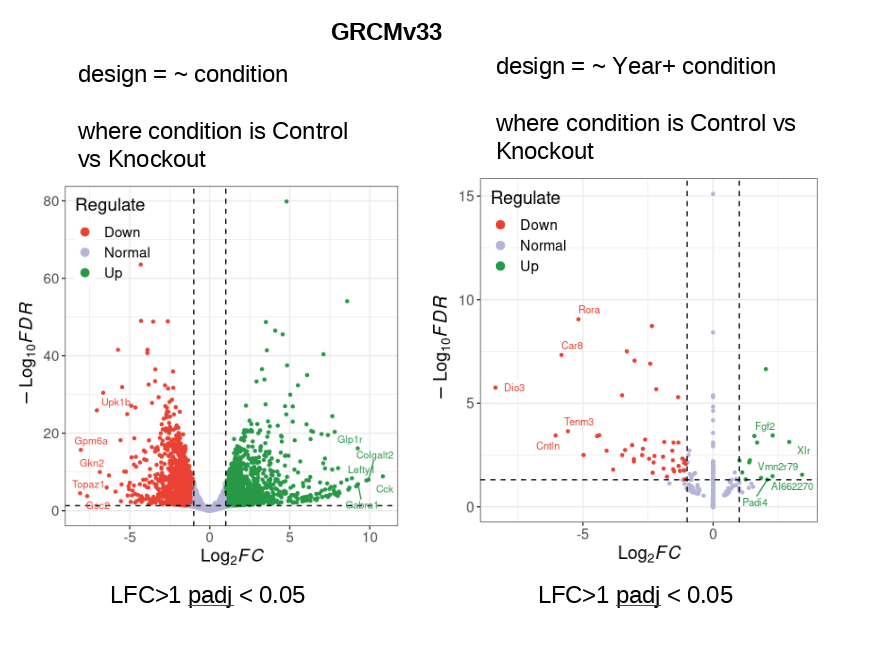
Are the two volcano plots from the exact same GRCMv33 data set, just analyzed with the different models of ~ condition or ~ Year + condition? If so, I think there is just something not right - how can the inclusion of Year remove almost all variation related to condition such that most genes now have 0 LFC? But yet some of the 0s somehow have -log10FDR = 15?! That just cannot be based on the PCA on the same data - adding year should only increase the condition differences. I would be triple-checking my sample metadata to make sure I had everything coded correctly and the DESeq outputs to make sure I was pulling the correct contrast.
Yes. The two volcano plots from the exact same GRCMv33 data set and just analyzed with the different models of ~ condition or ~ Year + condition. I know it's weird to have a volcano plot that's present on the right side.
Is year numeric or a factor/character?
Hi ATpoint, year is factor. DESeq2 automatically converts the character vector to factor
Yes, I know. But did you make absolutely sure year is a factor? What is the output of
is.numeric(dds$year). Results would make a lot of sense with a numeric year.It is not numeric.
I even tried this
I might have missed out one detail which might actually be relevant now that I revisited my code. Previously using old reference genome GRCMv28 I never performed in-silico ribodepletion step using
ribodetectorbut in my current code I did and I realized that control samples have more rRNA content as compared to knockouts i.e. only 34-48% of total reads are non-rRNA reads. I thought it might not be relevant initially because I never carried out this additional step last year and the results we obtained were matching our hypothesis but following up recent papers that carry out this step, we thought removal of such reads should be harmless. But I am not so sure now what's the consensus in the cancer RNAseq community about this?In order to seek answer as to why the same sample didn't segregate as clearly using grcm28 vs as they do now when using grcmv33, I went back to check if the genes majorly contributing to both PC1 and PC2 are same or different. I start by plotting the genes that have more influence on the PCs using
PCAtools::biplot. The 5 top loadings for each PCs are shown belowAs we can see they look identical. From these loadings I then retrieved top 500 genes and then intersected them and I see that a set of 40 genes are different in both old and new deseq2 object. If version is relevant I am using
DESeq2_1.40.2I also tried to see if these 40 genes in
new_500_genesare part of new annotation but only found 3 out of it to be new ruling out that newly detected genes might be influencing the PCS. Besides, when I look at the gene description obtained from both old and new PCA loadings, none of them are ribosomal RNA related gene ruling out the effect of ribodepletion step.This exploration might not explain why including
Yearas a co-variate in design formula results in so low DEGs but I was curious if there was an effect due to ribodepletion step.Are the new samples balanced in respect with the conditions of control and knockout? I can imagine that if the new samples are all (or mostly) of one of two conditions, they would soak up a lot of variance. I also don't get how your PCA logically links with the fact that there is the new "year" variable. Could you explain your logic again?
I don't understand what do you mean when you ask
Are the new samples balancedbut if you see the PCA plot, you can observe that we have control and knockout sequenced together in same year (a pair in 2020 and another in 2021). If you see GRCMv33 PCA plot you can see that the pair of samples (control and Knockout) from year 2020 segregates on PC2 (if you draw a horizontal line at 0 intercept on Y -axis). This segregation by year tells me that the "Year" variable is an interesting Covariate and I should account for it in my Deseq2 design formula.