Entering edit mode

Hi,
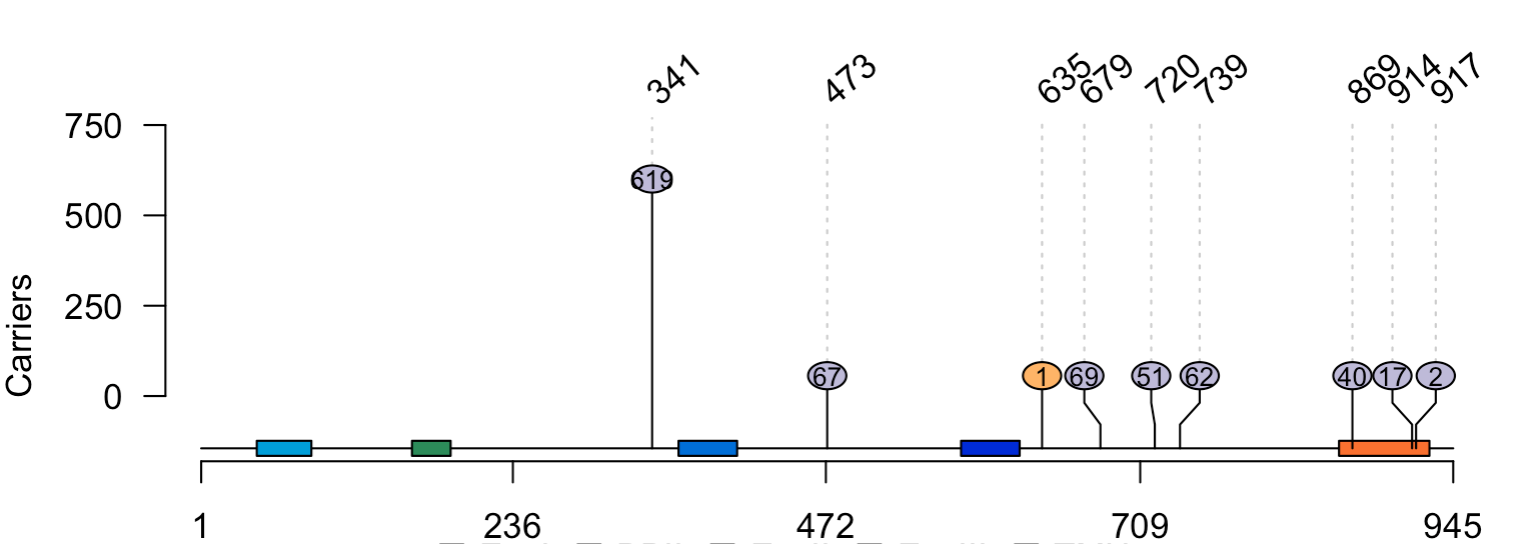
I am using trackViewer to display allele frequencies in a cohort by cDNA position.
The nodes are not aligning correctly to the Y axis. Same thing occurs when I log10 transform the values. Is there a problem with the axis scaling?
lolliplot(sample.gr,
          features,
          ylab="Carriers      \n",
          label_on_feature=FALSE,
          cex=1, legend=legend, size=12,
          ylab.gp=ylab.gp, yaxis.gp=yaxis.gp,
          xlab.gp=ylab.gp, xaxis.gp=yaxis.gp,
          ranges = GRanges("chr3", IRanges(1, sequence_length)))
sample.gr scores are integers: 619 67 1 69 51 62 40 17 2
Hi Thank you for reporting this. The bug should be fixed in both release and development version. Let me know if you still experience any issues.
Jianhong.