Entering edit mode

Hi!
I use cluster function from CATALYST package as follows:
sce <- cluster(sce, features = "type",
               xdim = 10, ydim = 10, maxK = maxk, seed = 1)
Each time I run the above function in a new R session I get slightly different results (e.g. percentages, clusters) using plotExprHeatmap
plotExprHeatmap(sce, features = "type", row_clust = TRUE, col_clust = FALSE,
                by = "cluster_id", k = kmeta,
                bars = TRUE, perc = TRUE)
.
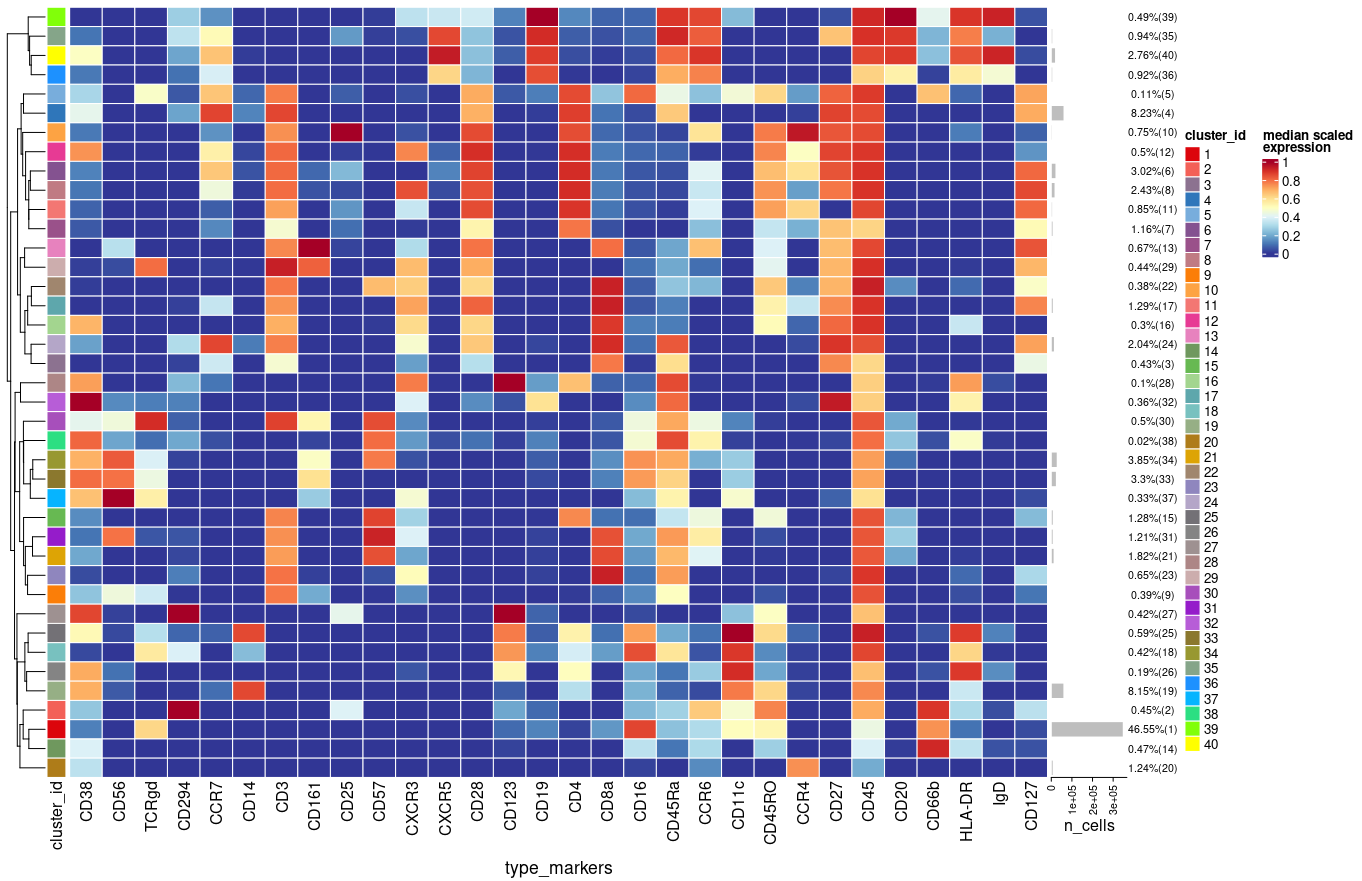
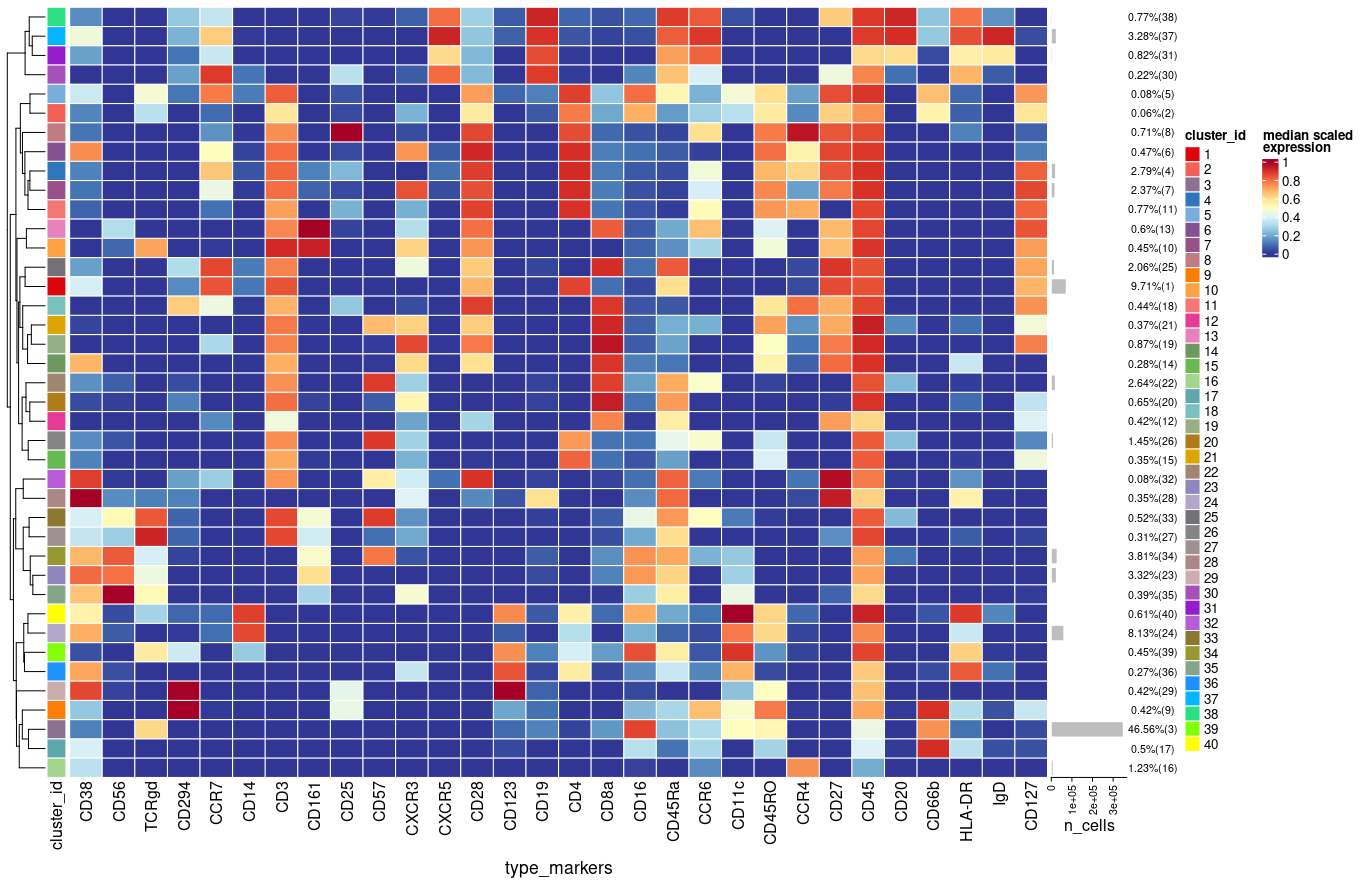
Is there any reason/explanation for that?
Thanks!
sessionInfo( )

R version 4.3.2 (2023-10-31)
Platform: x86_64-pc-linux-gnu (64-bit)
Running under: Ubuntu 22.04.3 LTS

Matrix products: default
BLAS:   /usr/lib/x86_64-linux-gnu/openblas-pthread/libblas.so.3
LAPACK: /usr/lib/x86_64-linux-gnu/openblas-pthread/libopenblasp-r0.3.20.so;  LAPACK version 3.10.0

locale:
 [1] LC_CTYPE=en_US.UTF-8       LC_NUMERIC=C               LC_TIME=en_US.UTF-8        LC_COLLATE=en_US.UTF-8
 [5] LC_MONETARY=en_US.UTF-8    LC_MESSAGES=en_US.UTF-8    LC_PAPER=en_US.UTF-8       LC_NAME=C
 [9] LC_ADDRESS=C               LC_TELEPHONE=C             LC_MEASUREMENT=en_US.UTF-8 LC_IDENTIFICATION=C

time zone: Europe/Athens
tzcode source: system (glibc)

attached base packages:
[1] stats4    stats     graphics  grDevices utils     datasets  methods   base

other attached packages:
 [1] cowplot_1.1.1               ggplot2_3.4.4               writexl_1.4.2               CATALYST_1.24.0
 [5] SingleCellExperiment_1.22.0 SummarizedExperiment_1.30.2 Biobase_2.60.0              GenomicRanges_1.52.0
 [9] GenomeInfoDb_1.36.1         IRanges_2.34.1              S4Vectors_0.38.1            BiocGenerics_0.46.0
[13] MatrixGenerics_1.12.2       matrixStats_1.1.0           flowCore_2.12.2             readxl_1.4.3

loaded via a namespace (and not attached):
  [1] bitops_1.0-7                gridExtra_2.3               sandwich_3.0-2              rlang_1.1.2
  [5] magrittr_2.0.3              clue_0.3-65                 GetoptLong_1.0.5            multcomp_1.4-25
  [9] scater_1.28.0               ggridges_0.5.4              compiler_4.3.2              DelayedMatrixStats_1.22.6
 [13] png_0.1-8                   vctrs_0.6.4                 reshape2_1.4.4              stringr_1.5.0
 [17] pkgconfig_2.0.3             shape_1.4.6                 crayon_1.5.2                backports_1.4.1
 [21] XVector_0.40.0              scuttle_1.10.3              utf8_1.2.4                  ggbeeswarm_0.7.2
 [25] purrr_1.0.2                 beachmat_2.16.0             zlibbioc_1.46.0             DelayedArray_0.26.7
 [29] BiocParallel_1.34.2         tweenr_2.0.2                irlba_2.3.5.1               broom_1.0.5
 [33] parallel_4.3.2              cluster_2.1.5               R6_2.5.1                    stringi_1.7.12
 [37] RColorBrewer_1.1-3          car_3.1-2                   cellranger_1.1.0            Rcpp_1.0.11
 [41] iterators_1.0.14            zoo_1.8-12                  nnls_1.5                    splines_4.3.2
 [45] Matrix_1.6-1                igraph_1.5.1                tidyselect_1.2.0            viridis_0.6.3
 [49] rstudioapi_0.15.0           abind_1.4-5                 doParallel_1.0.17           codetools_0.2-19
 [53] lattice_0.22-5              tibble_3.2.1                plyr_1.8.9                  withr_2.5.2
 [57] Rtsne_0.16                  survival_3.5-7              polyclip_1.10-6             ConsensusClusterPlus_1.64.0
 [61] circlize_0.4.15             pillar_1.9.0                ggpubr_0.6.0                carData_3.0-5
 [65] foreach_1.5.2               generics_0.1.3              colorRamps_2.3.1            RCurl_1.98-1.12
 [69] sparseMatrixStats_1.12.2    munsell_0.5.0               scales_1.2.1                gtools_3.9.4
 [73] glue_1.6.2                  tools_4.3.2                 BiocNeighbors_1.18.0        ggnewscale_0.4.9
 [77] data.table_1.14.8           ScaledMatrix_1.8.1          ggsignif_0.6.4              mvtnorm_1.2-2
 [81] XML_3.99-0.15               Cairo_1.6-2                 grid_4.3.2                  plotrix_3.8-4
 [85] tidyr_1.3.0                 RProtoBufLib_2.12.1         colorspace_2.1-0            GenomeInfoDbData_1.2.10
 [89] beeswarm_0.4.0              BiocSingular_1.16.0         ggforce_0.4.1               vipor_0.4.5
 [93] rsvd_1.0.5                  cli_3.6.1                   fansi_1.0.5                 viridisLite_0.4.2
 [97] cytolib_2.12.1              S4Arrays_1.0.4              ComplexHeatmap_2.16.0       dplyr_1.1.3
[101] gtable_0.3.4                rstatix_0.7.2               digest_0.6.33               FlowSOM_2.8.0
[105] ggrepel_0.9.4               TH.data_1.1-2               rjson_0.2.21                drc_3.0-1
[109] farver_2.1.1                lifecycle_1.0.4             GlobalOptions_0.1.2         MASS_7.3-60