Entering edit mode

Hello,
I'm trying to run DiffBind on my CUT&RUN data to get the differentially bound peaks between two conditions (DMSO and inhibitor). In sample_sheet.csv I only have the four samples I want to compare, two replicates each, and I'm running the following analysis:
samples_file=read.csv("sample_sheet.csv", header=T)
Diff_dba=dba(sampleSheet=samples_file)
Diff_dba_counts=dba.count(Diff_dba, minOverlap = 2)
Diff_dba_contrast <- dba.contrast(Diff_dba_counts, categories = DBA_TREATMENT, minMembers = 2)
Diff_dba_analyze <- dba.analyze(Diff_dba_contrast)
Diff_dba_report <- dba.report(Diff_dba_analyze, file="Diffbind_results", bNormalized = TRUE, th = 1)
However, when I run it, the output table looks like this:
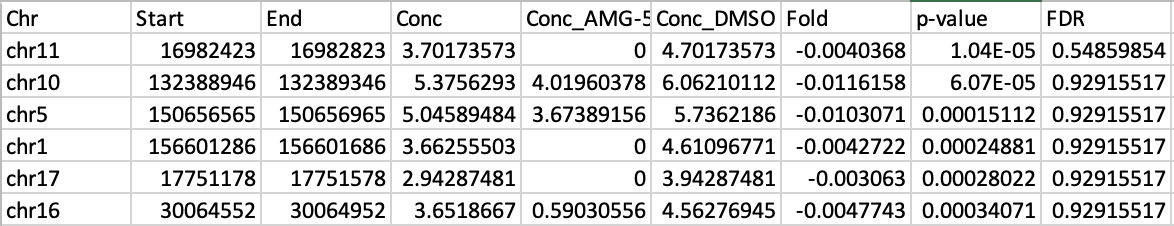
The Conc values look reasonable, but then the Fold values are completelly off, near 0, which would mean a near 1 Fold change, which is clearly not what the Conc values suggest. I really don't know what the issue is here, and I would appreciate any suggestions as to what I'm doing wrong/missing. Thank you in advance!
Almost certainly data are noisy and DESeq2 (which is used internally) shrinks the fold changes towards zero, because the naive fold changes (Conc_AMG vs Conc_DMSO) have no evidence to be reliable given the sample size and noise in the data. Do PCA and MAplots to explore how the data cluster and look.