Entering edit mode

Dear community,
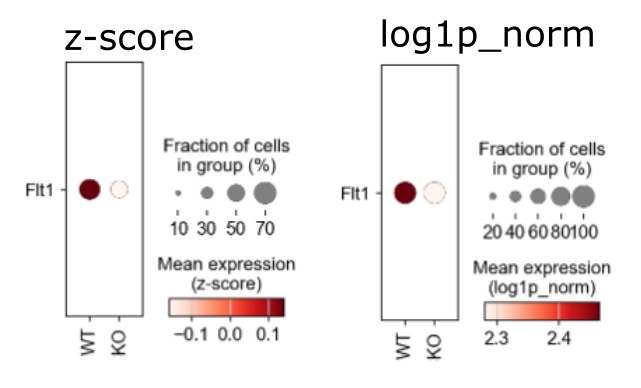
I found that a gene that has only a small fold-change between two conditions based on MAST, conversely appears to have a large difference if plotted in a scanpy dotplot:
MAST results:
gene    log2FC    pct.1   pct.2
Flt1    -0.02    0.98     0.99
In the dotplot, the difference looks even stronger than that of the top hit from MAST.
Unscaled normalized values were used for MAST.
Please note that the gene is highly expressed. Maybe that has an effect on MAST?
Any advice is appreciated!
Addendum: The effect size is not huge, but in the dotplot the difference looks even stronger that that of the MAST top hit (which has a 50-fold smaller pvalue).