Entering edit mode
HI,
I'm getting following warning from nullp function from goseq package.
pwf=nullp(gene.vector1, bias.data=length.vec)
Komunikat ostrzegawczy:
W poleceniu 'pcls(G)': initial point very close to some inequality constraints
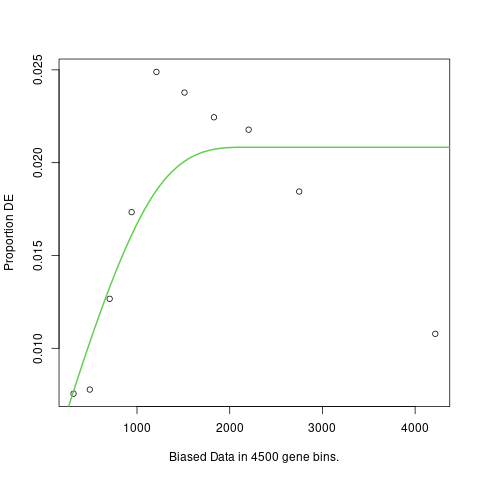
I've read here goseq: In pcls(G) : initial point very close to some inequality constraints that it is okay if the plot looks reasonably. In my case it is not,
I'm working on maize so I have to prepare input files manually, here is a summary of the files
> gene.vector1[1:5]
Zm00001eb015280 Zm00001eb000610 Zm00001eb033210 Zm00001eb044610 Zm00001eb014360
              0               0               0               0               0
> length.vec[1:5]
[1] 1624  385  990 1182  386
> length(gene.vector1)
[1] 44303
> length(length.vec)
[1] 44303
I have 746 DE genes.
Should I be concerned with such result?
Here is my setup
> sessionInfo()
R version 4.3.2 (2023-10-31)
Platform: x86_64-pc-linux-gnu (64-bit)
Running under: Ubuntu 22.04.3 LTS

Matrix products: default
BLAS:   /usr/lib/x86_64-linux-gnu/blas/libblas.so.3.10.0
LAPACK: /usr/lib/x86_64-linux-gnu/lapack/liblapack.so.3.10.0

locale:
 [1] LC_CTYPE=pl_PL.UTF-8       LC_NUMERIC=C
 [3] LC_TIME=pl_PL.UTF-8        LC_COLLATE=pl_PL.UTF-8
 [5] LC_MONETARY=pl_PL.UTF-8    LC_MESSAGES=pl_PL.UTF-8
 [7] LC_PAPER=pl_PL.UTF-8       LC_NAME=C
 [9] LC_ADDRESS=C               LC_TELEPHONE=C
[11] LC_MEASUREMENT=pl_PL.UTF-8 LC_IDENTIFICATION=C

time zone: Europe/Warsaw
tzcode source: system (glibc)

attached base packages:
[1] stats4    stats     graphics  grDevices utils     datasets  methods
[8] base

other attached packages:
[1] rtracklayer_1.60.0     GenomicRanges_1.52.0   GenomeInfoDb_1.36.1
[4] IRanges_2.34.1         S4Vectors_0.38.1       BiocGenerics_0.46.0
[7] goseq_1.52.0           geneLenDataBase_1.36.0 BiasedUrn_2.0.10

loaded via a namespace (and not attached):
 [1] KEGGREST_1.40.0             SummarizedExperiment_1.30.2
 [3] rjson_0.2.21                Biobase_2.60.0
 [5] lattice_0.22-5              vctrs_0.6.5
 [7] tools_4.3.2                 bitops_1.0-7
 [9] generics_0.1.3              curl_5.0.1
[11] parallel_4.3.2              tibble_3.2.1
[13] fansi_1.0.6                 AnnotationDbi_1.62.2
[15] RSQLite_2.3.1               blob_1.2.4
[17] pkgconfig_2.0.3             Matrix_1.6-5
[19] dbplyr_2.3.3                lifecycle_1.0.4
[21] GenomeInfoDbData_1.2.10     compiler_4.3.2
[23] stringr_1.5.0               Rsamtools_2.16.0
[25] Biostrings_2.68.1           progress_1.2.2
[27] codetools_0.2-19            RCurl_1.98-1.12
[29] yaml_2.3.7                  GO.db_3.17.0
[31] pillar_1.9.0                crayon_1.5.2
[33] BiocParallel_1.34.2         DelayedArray_0.26.6
[35] cachem_1.0.8                nlme_3.1-163
[37] tidyselect_1.2.0            digest_0.6.34
[39] stringi_1.7.12              dplyr_1.1.2
[41] restfulr_0.0.15             splines_4.3.2
[43] biomaRt_2.56.1              fastmap_1.1.1
[45] grid_4.3.2                  cli_3.6.2
[47] magrittr_2.0.3              S4Arrays_1.0.4
[49] GenomicFeatures_1.52.1      utf8_1.2.4
[51] XML_3.99-0.14               rappdirs_0.3.3
[53] filelock_1.0.2              prettyunits_1.1.1
[55] bit64_4.0.5                 XVector_0.40.0
[57] httr_1.4.6                  matrixStats_1.0.0
[59] bit_4.0.5                   png_0.1-8
[61] hms_1.1.3                   memoise_2.0.1
[63] BiocIO_1.10.0               BiocFileCache_2.8.0
[65] mgcv_1.9-1                  rlang_1.1.3
[67] glue_1.7.0                  DBI_1.1.3
[69] xml2_1.3.5                  R6_2.5.1
[71] MatrixGenerics_1.12.2       GenomicAlignments_1.36.0
[73] zlibbioc_1.46.0


Thanks, but the points suggest something like parabola and the plot has standard flat shape after initial rising.
The fact that the points look like a parabola suggests a problem with your data or the model you have fitted. It is not a problem caused by goseq.
goseq always fits monotonic increasing curves because that is the only shape of curve that can be caused by gene-length bias. In this case, the fitted curve that you see is the best possible monotonic curve compatible with your data. goseq does not fit parabolic curves because it is scientifically impossible for such a curve to arise from gene-length bias. The principles of goseq are explained in the documentation and published paper.
Thank you, I'm happy that this is only test data.