
I am currently conducting a differential expression analysis of small RNA-seq data using the DESeq2 package in R, and I have encountered unexpected behavior when using the lfcShrink() function to adjust fold-changes (FC). Specifically, I have noticed that in some cases, the lfcShrink() function appears to inflate the FC values.
I have an experimental design with 5 groups: a control group and 4 from different conditions. I filter the matrix of counts for each unique sequence so that I keep those sequences that have at least 5 counts in more than half of the samples in at least 1 group.
dds <- DESeqDataSetFromMatrix(countData = counts_table_final,
                                  colData = sampletable,
                                  design = ~ Group)
dds$Group <- relevel(dds$Group, ref ="C")
dds_2 <- DESeq(dds)

res_test <- results(dds_2, name ="Group_A2_vs_C", lfcThreshold = 0.585, alpha=0.05)
shrunk_test <- lfcShrink(dds_2, coef="Group_A2_vs_C", res=res_test)

res_test_tb <- res_test %>%
  data.frame() %>%
  rownames_to_column(var="seq") %>%
  as_tibble()

res_test_tb$lfcShrunk <- shrunk_test$log2FoldChange
res_test_tb$lfcShrunkSE <- shrunk_test$lfcSE
In general, I see that the correction works as expected, especially by decreasing very extreme LFCs. But if I inspect the sequences I see that strange things happen, as some sequences (aprox 13%) present an LFC after shrinkage in absolute value higher than the original LFC. It happens mostly in sequences with low baseMean, that are NS and/or that we cannot annotate as endogenous sRNA (it is important to note that we perform the annotation after DE, and therefore many of those sequences may have no biological relevance).
Although in many cases the difference is not very large, I also observe some extreme cases, e.g., a sequence going from 5.9 to 17.37 LFC after adjustment (A2 vs C), here the counts:
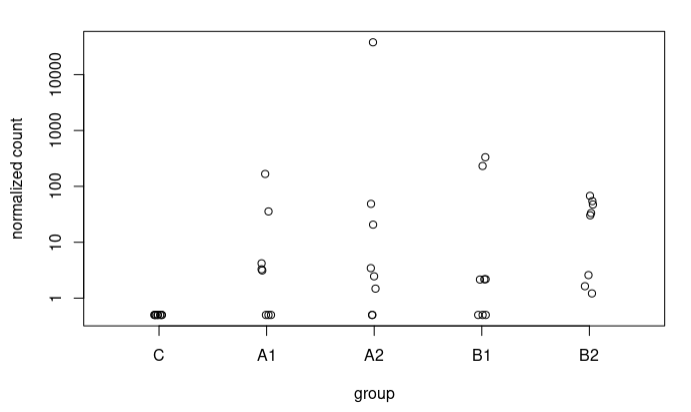
In most sequences I have plotted where I see such radical changes they present very low baseMean and 0 counts in the controls. When the baseMean is higher and the controls present counts, the increase in LFC Shrunken with respect to the original LFC is more subtle.
Although these are mostly sequences of little relevance to my study, I would like to understand why this occurs.
I have carefully reviewed my data and the documentation for the DESeq2 package, but I have not been able to identify the underlying cause of this phenomenon. I suspect that it may be related to the distribution of expression values and the characteristics of the data.

Many thanks for the quick response!
I understand this for the extreme case I have presented, where the counts are 0 for controls. What happens is that I also see these strange trends in other sequences where in controls we have some counts. For example, this sequence goes from an LFC of 1.49 to 3.67. These are the counts: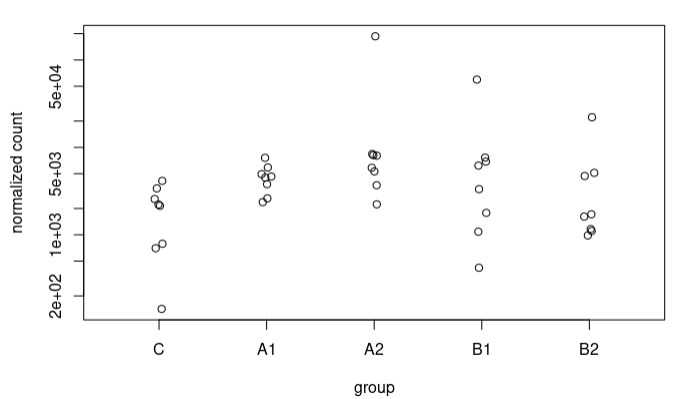
I don't know if somehow having a lot of very high LFCs because of what you comment could be affecting other more "normal" estimates. I guess a solution would be to apply stricter filtering of counts?
Have you made a scatterplot of the two LFC?
Yes, here they are.
Original LFCs: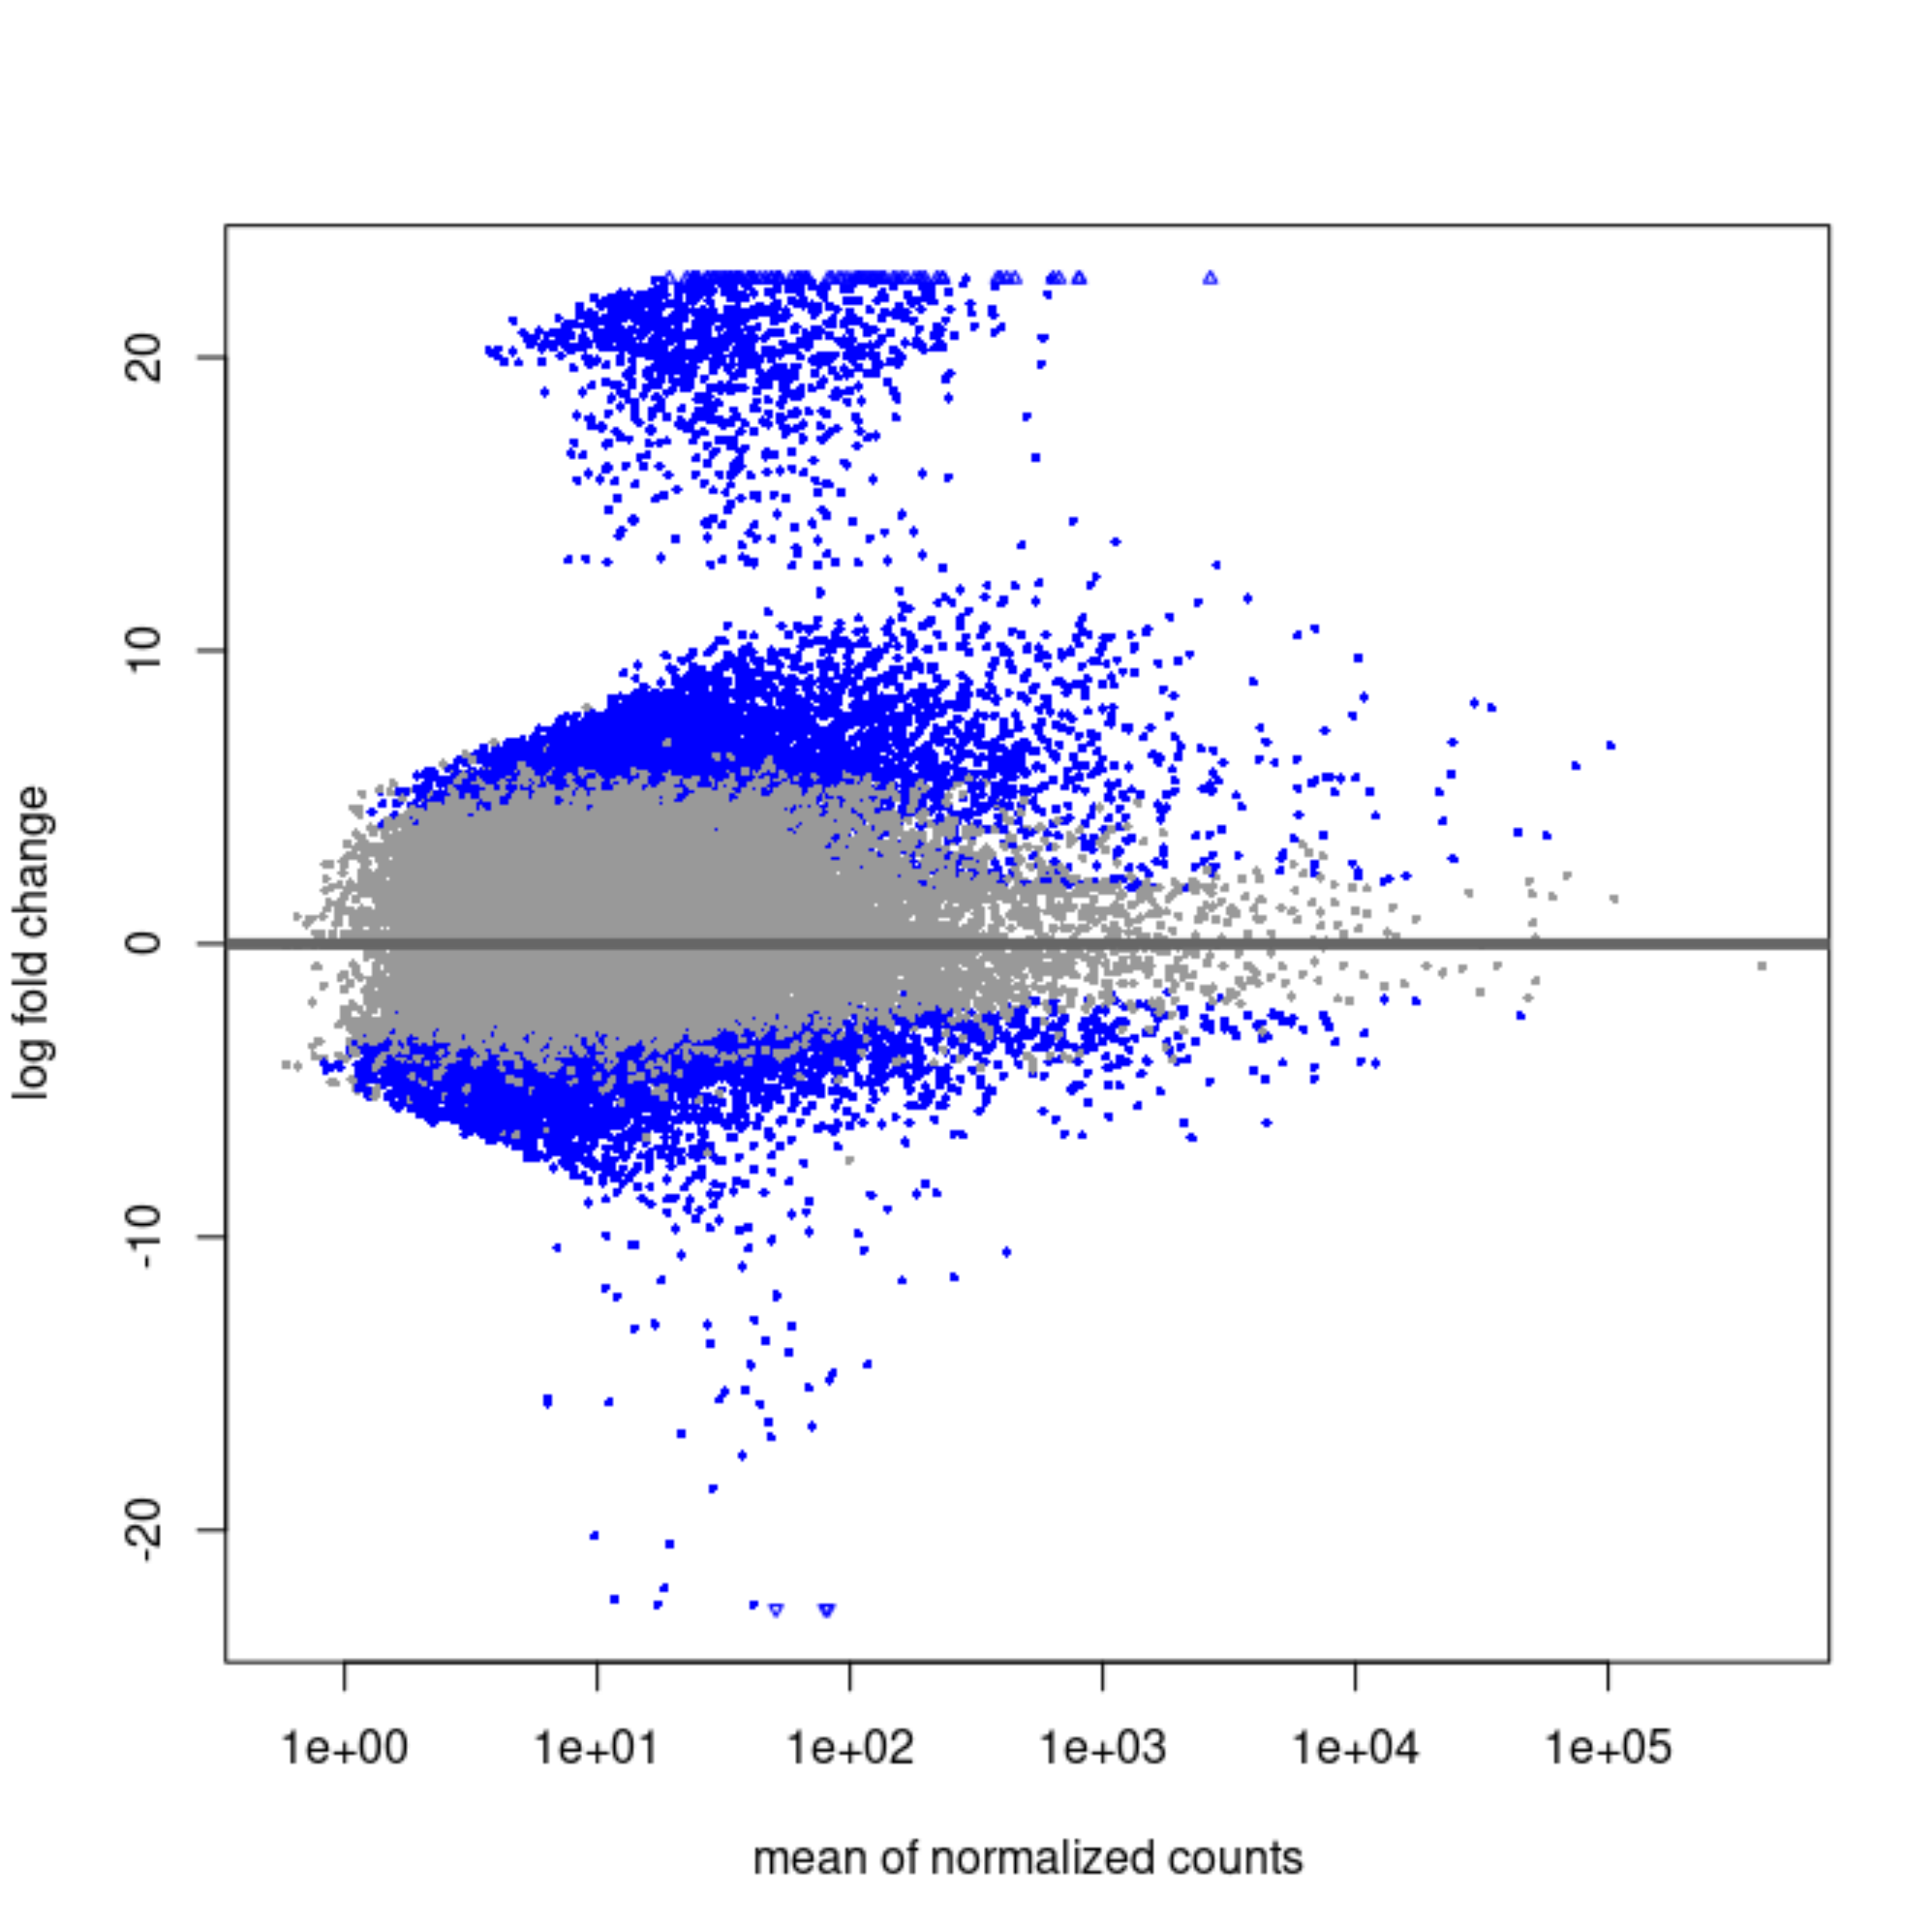
After shrinkage:
Sorry I meant x=regular, y=shrunken.
It strikes me that the first MA plot looks like there is a prior being used.
Can you print here what you see (the whole printout) when you print
res_testto console?Oh sorry, I thought you meant MAplots.
Here it is the print of
res_test:Got it.
So a scatterplot of the two LFC against each other would be informative.
Perfect, here it is:
Can you repeat with the other two
typeoptions?Of course
ashr:
normal:
So note that ashr receives the regular LFC as input (not the counts) and so it makes sense it is the most consistent with the LFC. It shrinks based on the SE and the distribution of observed LFC.
So the blob of genes with LFC ~20 is this one that's immeasurable. Shrinkage will bring them to 0 if the counts are scattered and near zero in the group that is not entirely 0's.
For the others, what is happening is likely that the counts are very heterogeneous across the groups, maybe some outliers in single groups and mostly zeros in the others.
You might chose to clean the data a bit more before modeling, e.g.:
keep those sequences that have at least 10 counts in 5 samples.
Finally, you could subset to two group comparisons, to better satisfy the modeling assumption of equal dispersion across the two groups.
Perfect, thank you very much!
Just one more question to make sure I got it right, you mean the counts matrix we give to DESeqDataSetFromMatrix() should be the one containing only the samples of the two groups we compare in each case? Filtered as you propose.
Yes that is what I meant