Entering edit mode
Hi!
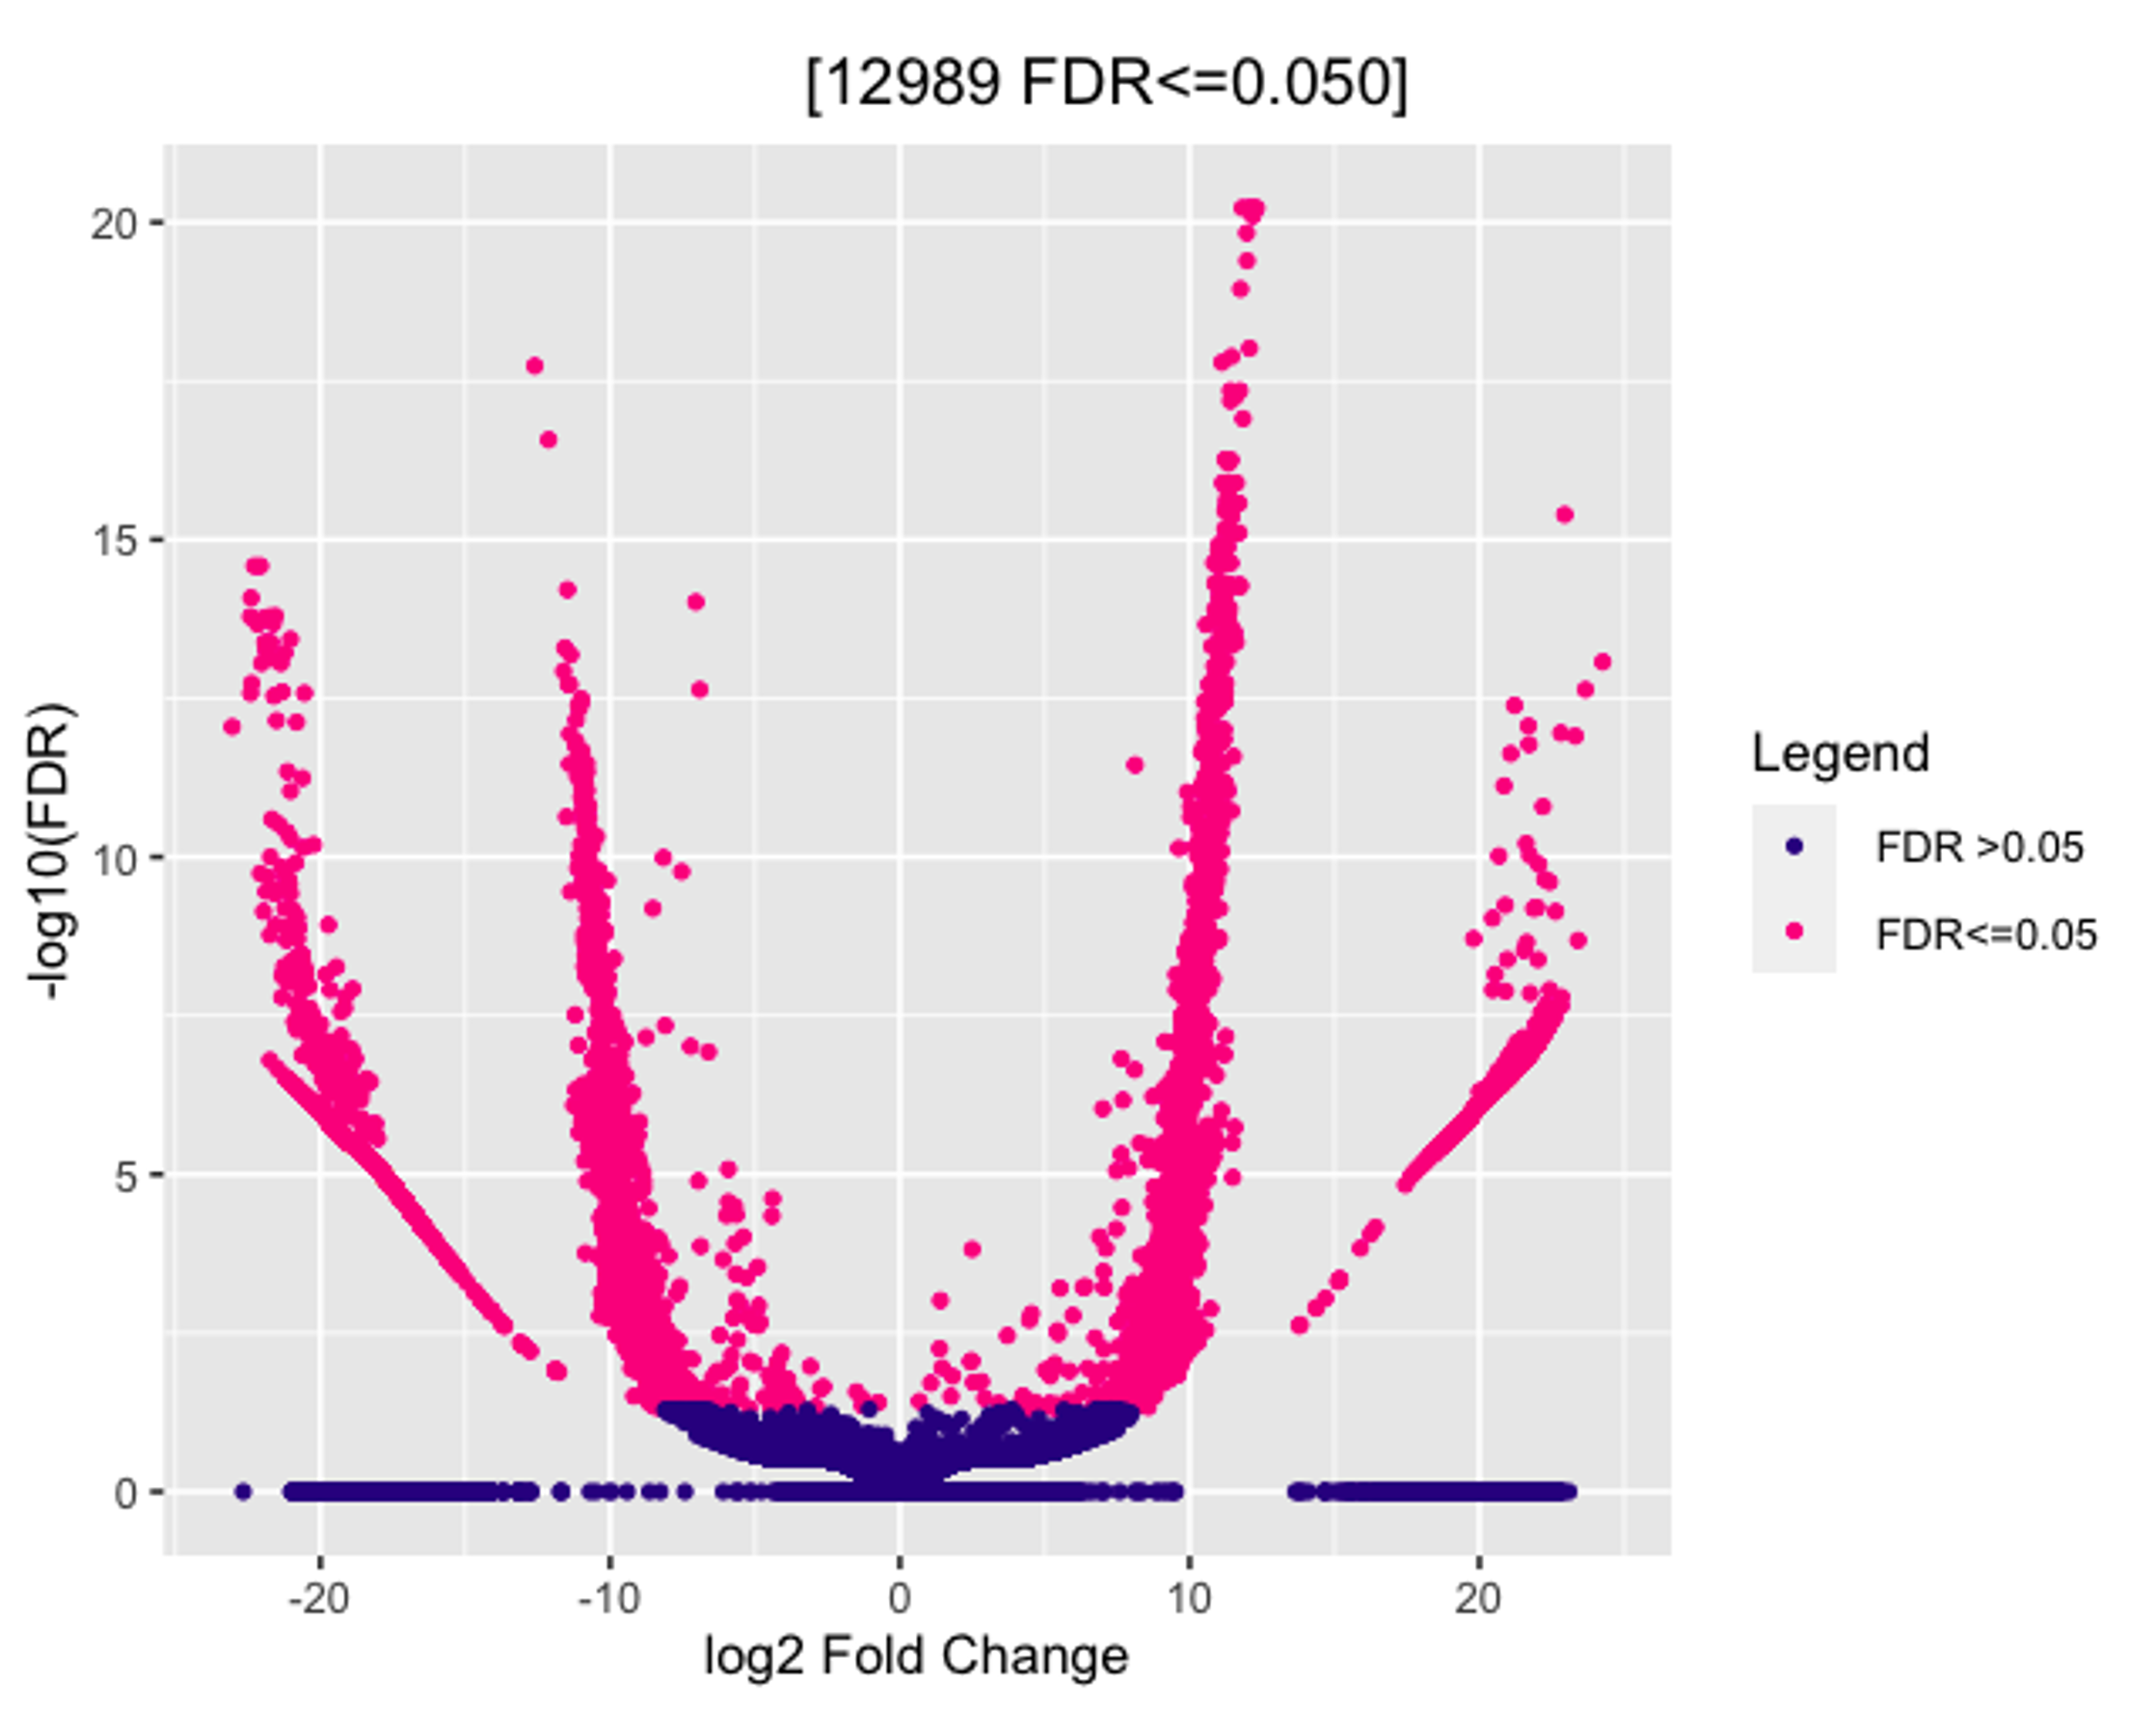
I am trying to run Diffbind with DESeq2 on my Cut&Run dataset. I have tried multiple normalization methods in dba.count() and dba.normalize() and am unsure which is the most "fitting" for my data. No matter which method I use the Volcano plot looks something like this (see image). At the bottom is a clustering of hits and the extended arms of the plot seem to show a bin-ing effect. Is there any way to get rid of this? When plotted against p-values and not FDR, the results are the same.
Thank you all in advance,
Here is my code and session:
dba <- dba(sampleSheet=sample_sheet)
dba <- dba.count(dba, score = DBA_SCORE_READS_FOLD, summits = TRUE)
dba <- dba.normalize(dba, method = DBA_DESEQ2, normalize = DBA_NORM_RLE, background=TRUE)
dba <- dba.contrast(dba, reorderMeta=list(Condition="crtl"))
dba <- dba.analyze(dba, method=DBA_DESEQ2, bBlacklist = DBA_BLACKLIST_MM10, bGreylist = "BSgenome.Mmusculus.UCSC.mm10")

# volcano plot
dba.plotVolcano(dba, contrast=1)

sessionInfo( )

R version 4.3.2 (2023-10-31)
Platform: aarch64-apple-darwin20 (64-bit)
Running under: macOS Monterey 12.4

Matrix products: default
BLAS:   /System/Library/Frameworks/Accelerate.framework/Versions/A/Frameworks/vecLib.framework/Versions/A/libBLAS.dylib
LAPACK: /Library/Frameworks/R.framework/Versions/4.3-arm64/Resources/lib/libRlapack.dylib;  LAPACK version 3.11.0

locale:
[1] en_US.UTF-8/en_US.UTF-8/en_US.UTF-8/C/en_US.UTF-8/en_US.UTF-8

time zone: Europe/Copenhagen
tzcode source: internal

attached base packages:
[1] stats4    stats     graphics  grDevices utils     datasets  methods   base

other attached packages:
 [1] BSgenome.Mmusculus.UCSC.mm10_1.4.3
 [2] BSgenome_1.70.2
 [3] rtracklayer_1.62.0
 [4] BiocIO_1.12.0
 [5] Biostrings_2.70.2
 [6] XVector_0.42.0
 [7] ggalt_0.4.0
 [8] magick_2.8.3
 [9] TxDb.Mmusculus.UCSC.mm10.knownGene_3.10.0
[10] org.Mm.eg.db_3.18.0
[11] rsq_2.6
[12] EnhancedVolcano_1.20.0
[13] ggrepel_0.9.5
[14] edgeR_4.0.15
[15] limma_3.58.1
[16] csaw_1.36.1
[17] org.Hs.eg.db_3.18.0
[18] TxDb.Mmusculus.UCSC.mm10.ensGene_3.4.0
[19] GenomicFeatures_1.54.3
[20] AnnotationDbi_1.64.1
[21] readxl_1.4.3
[22] lubridate_1.9.3
[23] forcats_1.0.0
[24] stringr_1.5.1
[25] purrr_1.0.2
[26] readr_2.1.5
[27] tidyr_1.3.1
[28] tibble_3.2.1
[29] ggplot2_3.4.4
[30] tidyverse_2.0.0
[31] ChIPseeker_1.38.0
[32] DiffBind_3.12.0
[33] dplyr_1.1.4
[34] profileplyr_1.18.0
[35] SummarizedExperiment_1.32.0
[36] Biobase_2.62.0
[37] GenomicRanges_1.54.1
[38] GenomeInfoDb_1.38.6
[39] IRanges_2.36.0
[40] S4Vectors_0.40.2
[41] MatrixGenerics_1.14.0
[42] matrixStats_1.2.0
[43] BiocGenerics_0.48.1


