Strange logFC values in differential methylation site anslysis
1
0
Entering edit mode
mico • 0
@mico-15362
Last seen 7 weeks ago
United States

Extending my previous question -

I have a single-cell methylation dataset (7 samples and 18 celltypes) and am identifying differentially methylated sites across cell types. Different cell types have different global methylation frequencies due to biological and technical factors. I basically followed the steps in edgeR tutorial and the f1000 paper, however the results (particularly the logFC) look weird. Here is what I did:

1 load files

yall <- readBismark2DGE(file.df$file, sample.names=file.df$sample)

chr.names <- paste0('chr', c(1:19,"X","Y"))
yall$genes$Chr <- factor(yall$genes$Chr, levels=chr.names)
o <- order(yall$genes$Chr, yall$genes$Locus)
yall <- yall[o,]

2 filter and normalize

samples <- paste0("samp", c(1:7))
samp.celltypes <- expand.grid(samples, celltypes)
samp.celltypes <- paste(samp.celltypes$Var1, samp.celltypes$Var2, sep=".")
samp.ct.coverage <- lapply(samp.celltypes, function(samp) {
  rowSums(yall$counts[, grepl(samp, colnames(yall))])
})
samp.ct.coverage <- do.call(cbind, samp.ct.coverage)
colnames(samp.ct.coverage) <- samp.celltypes

has.coverage <- rowSums(samp.ct.coverage >= 8) >= 3*length(celltypes) # in at least 3 samples...
table(has.coverage)
# has.coverage
# FALSE  TRUE 
# 10698  1307 

# make lib.size eqaul in each sample_celltype's Me and Un
y <- yall[has.coverage, , keep.lib.sizes=FALSE]
me <- gl(2, 1, ncol(yall), labels=c("Me","Un"))
total.libsize <- 0.5 * y$samples$lib.size[me=="Me"] +
    0.5 * y$samples$lib.size[me=="Un"]
y$samples$lib.size <- rep(total.libsize, each=2)

3 construct design matrix and fit

design0 <- model.matrix(~0 + celltype + sample0, data=file.df)
design <- modelMatrixMeth(design0)

y <- estimateDisp(y, design=design, trend="none")
# y$common.dispersion
# [1] 0.01661841
summary(y$prior.df)
#   Min. 1st Qu.  Median    Mean 3rd Qu.    Max. 
#   Inf     Inf     Inf     Inf     Inf     Inf 

fit1 <- glmQLFit(y, design, robust=TRUE, prior.count=2)

file.df is like

head(file.df,1)
      sample                              file sample0 celltype batch sex
1 samp1.cDCP edgeR/inputs/samp1.cDCP.cov.txt.gz   samp1     cDCP     1   F

4 then do the QLFtest

compute_qlf <- function(fit, celltypes, design) {
  n.clusters <- length(celltypes)
  w.oths <- 1 / (1-n.clusters)
  qlf <- list()
  for (celltype in celltypes) {
    print(celltype)
    # initiate contrast matrix using random celltypes
    contr <- makeContrasts(
      celltype_i = celltypeCyc_Prog1 - celltypeCyc_Prog2, levels = design
    )
    # 1 vs others
    contr[grepl("celltype", rownames(contr)),] <- 0
    contr[rownames(contr) %in% paste0("celltype", celltypes),] <- w.oths
    contr[rownames(contr)==paste0("celltype", celltype)] <- 1
    print(contr)
    qlf[[celltype]] <- glmQLFTest(fit, contrast=contr)
    qlf[[celltype]]$comparison <- paste0(celltype, "_vs_others")
    plotMD(qlf[[celltype]])
  }
  qlf
}

site.qlf <- compute_qlf(fit1, celltypes, design)

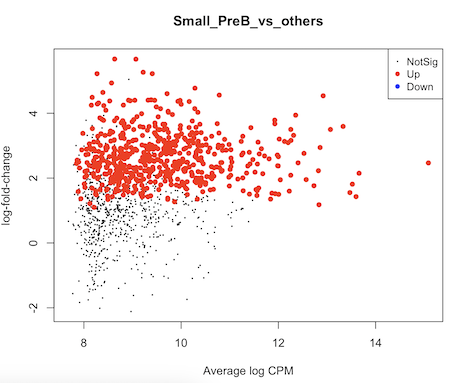
It seems to me that the test didn't account for celltype-specific methylation activity. For example in this MD plot, small preB cells in general have higher methylation frequency compared to others, but their logFCs shift to positive direction as well. Is there any mistake in my code? Or are there suggestions to run some diagnoses/sanity checks? thank you very much.

preb

edgeR MethylationArray • 703 views
ADD COMMENT
0
Entering edit mode

It's pretty hard to interpret or debug your compute_qlf function. It's pretty hard to tell what contrast you are testing. Could you not make it a little easier for us?

ADD REPLY
0
Entering edit mode

uhm it's similar to the makeContrast code in the pseudobulk single cell example in edgeR tutorial

> ncls <- nlevels(cluster)
> contr <- rbind( matrix(1/(1-ncls), ncls, ncls),
+                 matrix(0, ncol(design)-ncls, ncls) )
> diag(contr) <- 1
> contr[1,] <- 0
> rownames(contr) <- colnames(design)
> colnames(contr) <- paste0("cluster", levels(cluster))
> contr

one of my example is

                    Contrasts
Levels                 celltype_i
  Sample1              0.00000000
  Sample2              0.00000000
  Sample3              0.00000000
  Sample4              0.00000000
  Sample5              0.00000000
  ...
  celltypecDCP        -0.05882353
  celltypeCyc_Prog1   -0.05882353
  celltypeCyc_Prog2   -0.05882353
  celltypepDCP         1.00000000
  ...
  sample0samp2         0.00000000
  sample0samp3         0.00000000
  sample0samp4         0.00000000
  sample0samp5         0.00000000
  sample0samp6         0.00000000
  sample0samp7         0.00000000

There are 18 celltypes here,
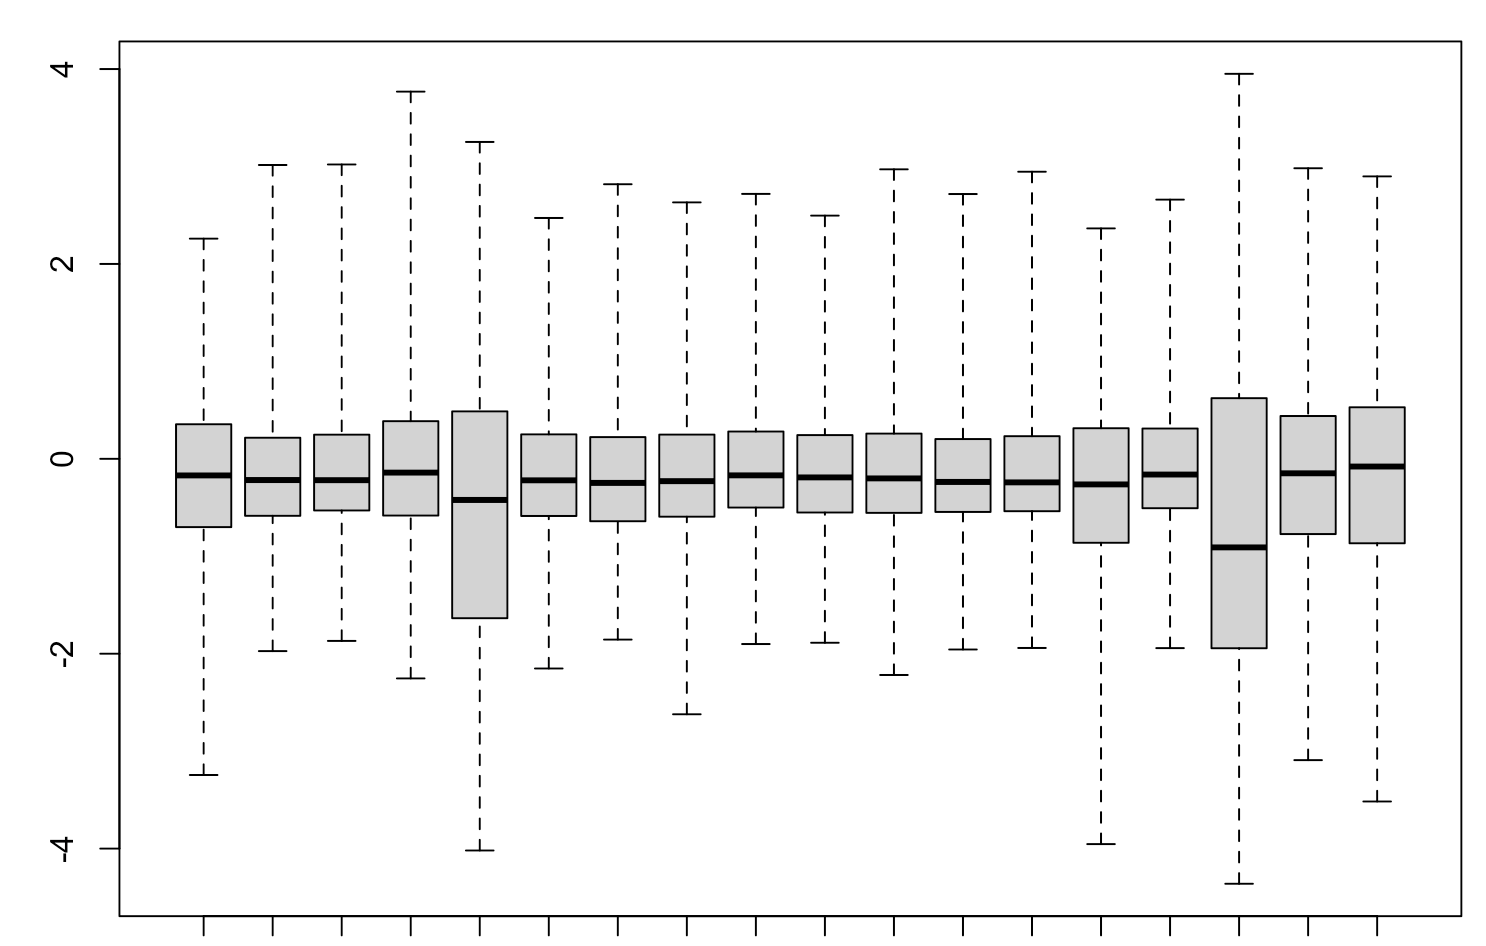
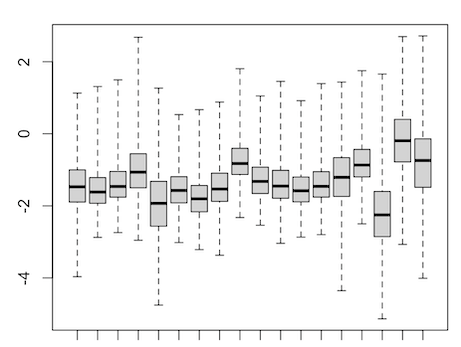
 -0.05882353 is from -1/17

ADD REPLY
0
Entering edit mode

actually in my case, if I didn't set the lib.size for Me and Un to be the same, the logFC values look fine

ADD REPLY
0
Entering edit mode

Yes, of course, because you are forcing all the log-ratios of methylation to be about zero, without regard to the actual data. As I have told you before, you are not even measuring methylation anymore.

ADD REPLY
0
Entering edit mode
@gordon-smyth
Last seen 1 minute ago
WEHI, Melbourne, Australia

Can you please show the plot from

j <- grep("celltype",colnames(fit1))
boxplot(as.data.frame( coef(fit1)[,j] ), range=0)
ADD COMMENT
0
Entering edit mode

this is the plot when i didn't set Me & Un lib.size to be equalbox

ADD REPLY
0
Entering edit mode

I asked you to show me results from the fit1 object that was created using the code in your question. I need to see that in order to help you.

You have instead showed me something that has no meaning. I previously told you "it is completely wrong to apply TMM normalization, or any sort of library size normalization, to methylation data". You must set the library sizes equal for Me and Un, otherwise the results are meaningless. Otherwise you are not measuring the methylation proportion at all.

I can't emphasise this enough. If you use the library sizes in order to get the results you want, it is a type of scientific falsification.

ADD REPLY
0
Entering edit mode

okay, this is the plot from the fit1 object from the original code enter image description here

ADD REPLY
0
Entering edit mode

The vertical axis is the log-ratio of methylated to unmethylated reads (on the natural log scale). The boxes are mostly below zero showing that most reads are unmethylated. The plot shows very large global differences in methylation levels between cell types. For example, cell-type 17 has ten times more methylation than cell-type 16, and this increase in methylation is consistent across almost all the loci, not just a few.

Given the large global changes in methylation between cell-types, the unbalanced MD plot that edgeR generated is to be expected. It is not an error of the edgeR analysis but appears to be a true reflection of the data.

If you don't think that the cell-types should be so different, then you would need to trouble-shoot why the data is like this.

ADD REPLY
0
Entering edit mode

Yes, there are global differences in methylation levels between different cell types as I stated in the question. I want to account for this cell type specific global methylation level in the model, I however don't know how to do it in edgeR yet.

ADD REPLY
0
Entering edit mode

What you say you want to do seems contradictory. You are using edgeR to detect methylation differences between the cell types, but you say that you also want edgeR to remove differences between the cell types at the same time. I can't imagine that any software tool would do that and I don't know what it would mean if they did.

You have not explained what statistical hypothesis you are trying to test, as least not in a way that I can understand. edgeR can test almost any reasonable hypothesis, but it does need to be a precisely stated null hypothesis that is testable from the data.

I think I have helped you as much as I can. edgeR seems to be working correctly and is doing what it is designed to do. The MD plot isn't strange but is what is expected.

ADD REPLY

Login before adding your answer.

Traffic: 575 users visited in the last hour
Help About
FAQ
Access RSS
API
Stats

Use of this site constitutes acceptance of our User Agreement and Privacy Policy.

Powered by the version 2.3.6