Hi,
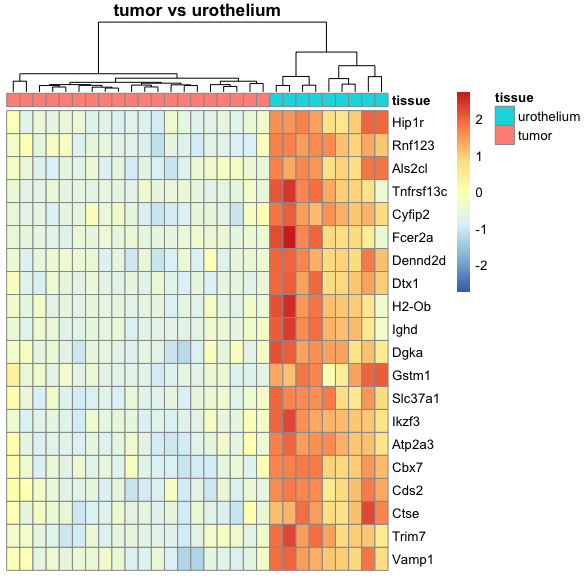
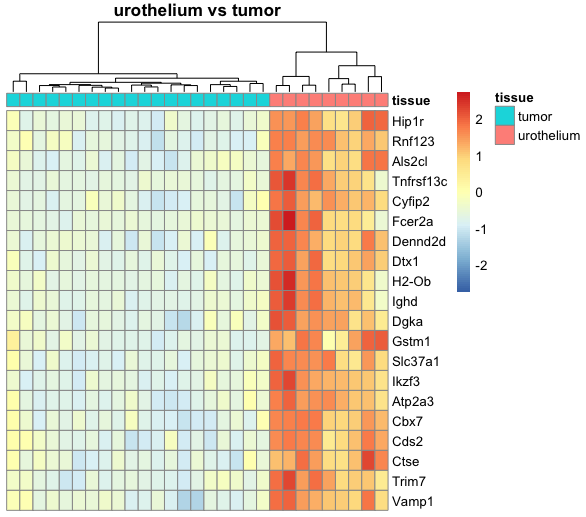
I am relatively new to performing DESeq2 analysis and I have a dataset where I am trying to compare mice tumor tissue with urothelium tissue. Because R automatically chooses a reference level for factors based on alphabetical order, I set the factor levels such that the comparison is tissue_tumor_vs_urothelium instead of the other way around, tissue_urothelium_vs_tumor. This is because I am trying to create a heatmap where the top 20 genes of the tumor tissue are expressed compared to the urothelium tissue.
dds = DESeqDataSetFromMatrix(countData = alltumordata, colData = alltumor, design = ~ tissue)
dds$tissue <- factor(dds$tissue, levels = c("urothelium","tumor"))
dds = DESeq(dds)
However, the resulting tissue_tumor_vs_urothelium heatmap that I generated with pheatmap looks the same as the previous tissue_urothelium_vs_tumor heatmap, as in the top 20 genes of urothelium tissue are expressed compared to the tumor tissue. I am not sure if this is a problem from my heatmap code or from the DESeq2 pipeline, and I appreciate any insight on how I can change this. For reference, my heatmap function is shown below:
deseqoutputHM <- function(dds, vsd, comparison) {
  tt <- str_split(str_sub(comparison, 8),"_")[[1]]
  res <- lfcShrink(dds, coef = comparison, type="apeglm")

  #get the tissue data out of the dds
  df <- as.data.frame(colData(dds)[,c("tissue")])
  colnames(df)[1] <- "tissue"

  #select the 20 genes with the lowest P-values
  select <- order(res$padj)[1:20]

  #take the expressions of these genes
  mat <- assay(vsd)[select,]
  colnames(mat) <- rownames(df)

  #heatmap w/compared tissues
  OP_HM <- pheatmap(mat, cluster_rows=FALSE, show_rownames=TRUE,
                    show_colnames=FALSE, scale = "row",
                    cluster_cols=TRUE, annotation_col=df,
                    main = paste(tt, collapse = " "))
  return(list(OP_HM))
}

tumor_urotheliumHM = deseqoutputHM(dds = dds, vsd = vsd, comparison = "tissue_tumor_vs_urothelium")
urothelium_tumorHM = deseqoutputHM(dds = dds2, vsd = vsd2, comparison = "tissue_urothelium_vs_tumor")