Entering edit mode

Enter the body of text here
hi, I am working on a GEO microarray dataset, 5 groups were defined and assigned to the Expressionset.
Beform vooma I used exprs(gset) <- normalizeBetweenArrays(exprs(gset)) after log2 transformation,
and used gset <- gset[complete.Cases(exprs(gset)), ] to remove missing value, as suggested in the manual.
so when I run vooma, I see this mean-variance trend,
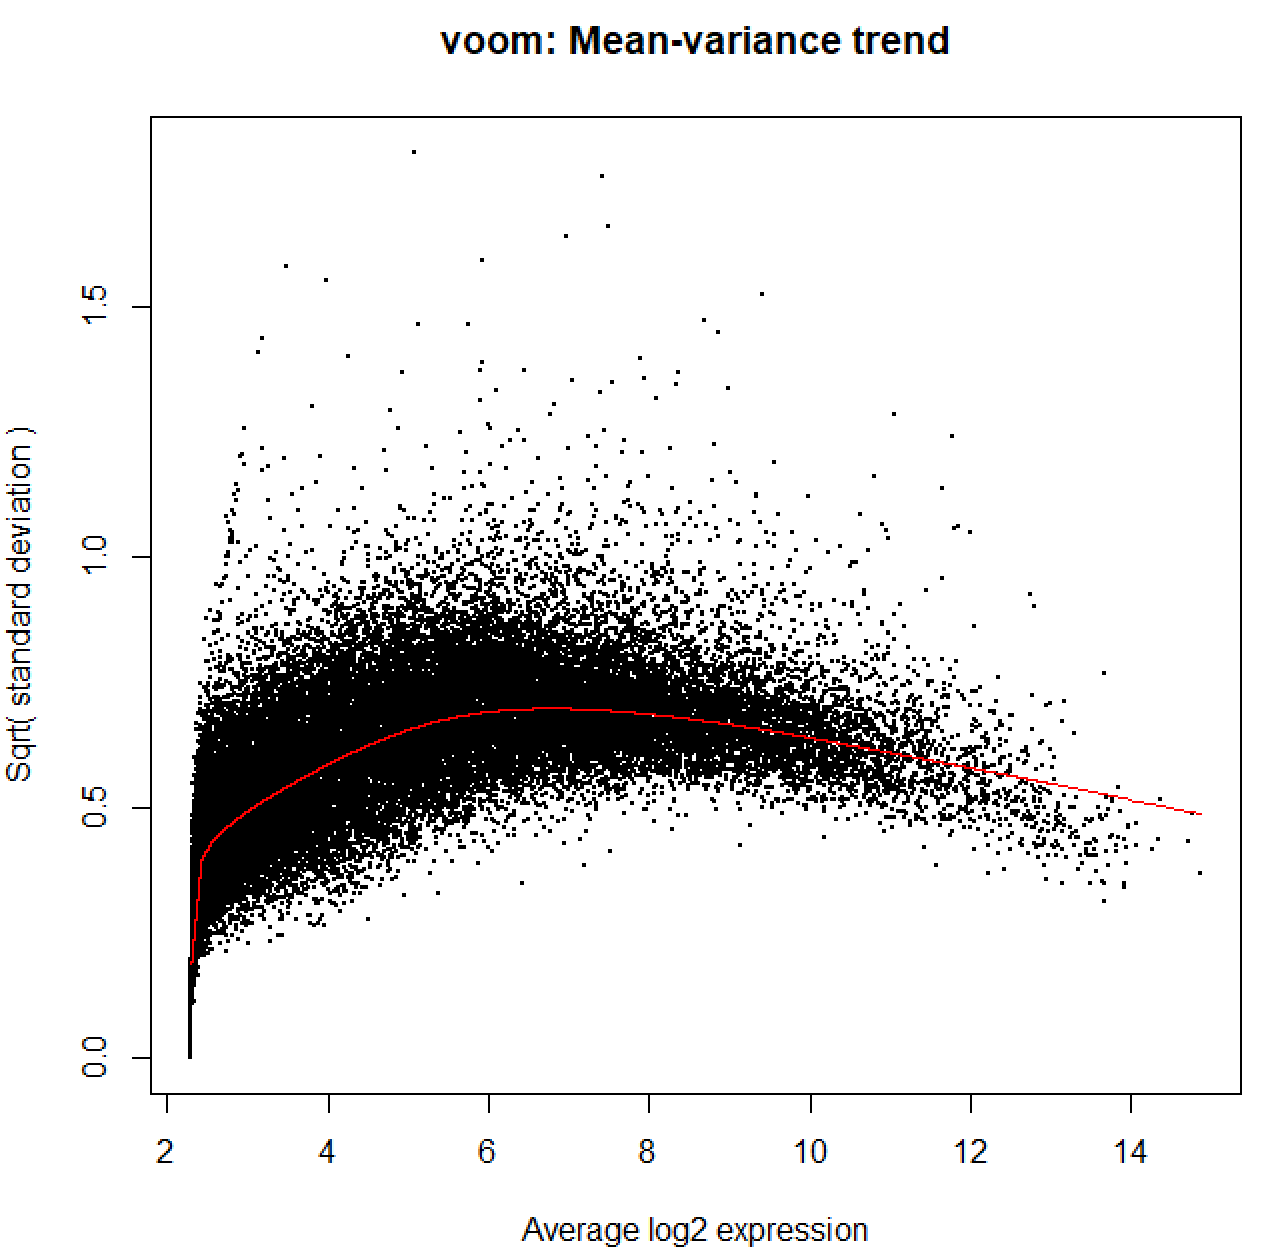
I understand this graph does not reflect data quality, but I wonder if
a) is vooma appropriate for weighted distribution? or should I use voomaByGroup instead?
b) is there any more data filtering process I need to add beform vooma and lmFit in this case?
or in other words, how can I ensure that my data is properly processed?
Many thanks! Lily C

Hi Gordon, Thank you very much for your clarification to my question. I must admit that my wording in describing my issues was not precise enough, and I apologize for the confusion.
I was first frustrated with the mean-variance trend that started from 2 instead of 0, therefore wondered if I needed to further filter my data. The "manual" I mentioned refers to the pdf manual on Bioconductor, limma package. It is also where I found the
voomaByGroup()from.Where I adapted the
normalizeBetweenArrays()andcomplete.Cases()was from the GEO2R R script before I could adjust and analyze the GEO dataset locally in R.Originally, I was stuck at obtaining the full statistic after
lmFit()andtopTable()from each contrast when I started to set contrast more than one, hence the idea to export "each set of statistics data" one by one in multiplevoomaByGroup(). After your reply I went back and was able to extract by using thecoefintopTable().After all, thank you so much for your patience when I was poorly describing my question. Thank you and thank you !
Lily C
Hi Lily,
The voom methods all require some filtering of low expression genes so, yes, almost certainly you should do some filtering.
In my answer, I hinted that you should let us know which GEO dataset you are working on so that we know which type of microarray platform it is and hence could give more specific advice. You haven't quite taken my hint yet!
Regards Gordon
Hi Gordon,
apologies that I did not get your hint before! It is the GSE45291 dataset. Thanks again for the reminder and patience!
Lily C
OK, this is Affymetrix data that is already gcrma normalized. Most of the steps you are using are unnecessary! There's no need for
complete.casesornormalizeBetweenArraysorvooma. See the Affymetrix case study in the limma User's Guide.I would suggest a little bit of filtering:
Other than that, you can go straight into linear modelling:
No need for weights.
thank you SO MUCH for the help Gordon! I will have a try later!