
Hi, I am trying out some packages for PCA in combination with the reads-to-genes edgeR-workflow for my RNA-seq analysis. I used the directions given from this post: Trying to do a PCA using edgeR with expression data
Group is equivalent to the Biomarkerquartiles_Q variable.
When I use the plotMDS function with the following code:
keep <- filterByExpr(y, group = y$samples$group)

y <- y[keep, ,
       keep.lib.sizes = F]

y <- calcNormFactors(y)

pch <- c(0,1,2,15,16,17)
colors <- rep(c("darkgreen", "red", "blue"), 2)
plotMDS(y, col=colors[factor(targets$Biomarkerquartiles_Q)],
        pch=pch[factor(targets$Biomarkerquartiles_Q)],
        gene.selection="common")

legend("topleft", legend=levels(factor(targets$Biomarkerquartiles)),
       pch=pch, col=colors, ncol=2)
I get this plot:
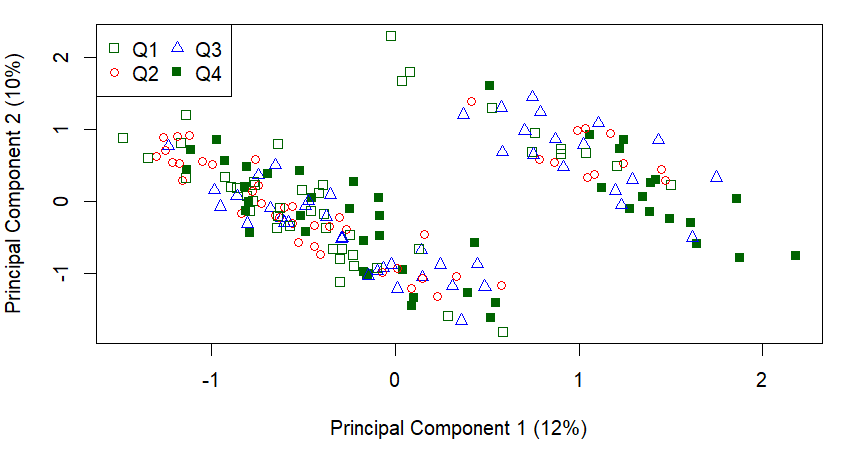
And although there is no clear clustering of the quartiles, it is pretty clear that there is some clustering going on.
When I use the PCAtools package with the following code:
p <- pca(cpm(y, log = T),
         metadata = y$samples,
         removeVar = 0.1)
PCA.plot <- biplot(p,
    lab = paste0(p$metadata$group),
    colby = "group"
)
I get the following plot:
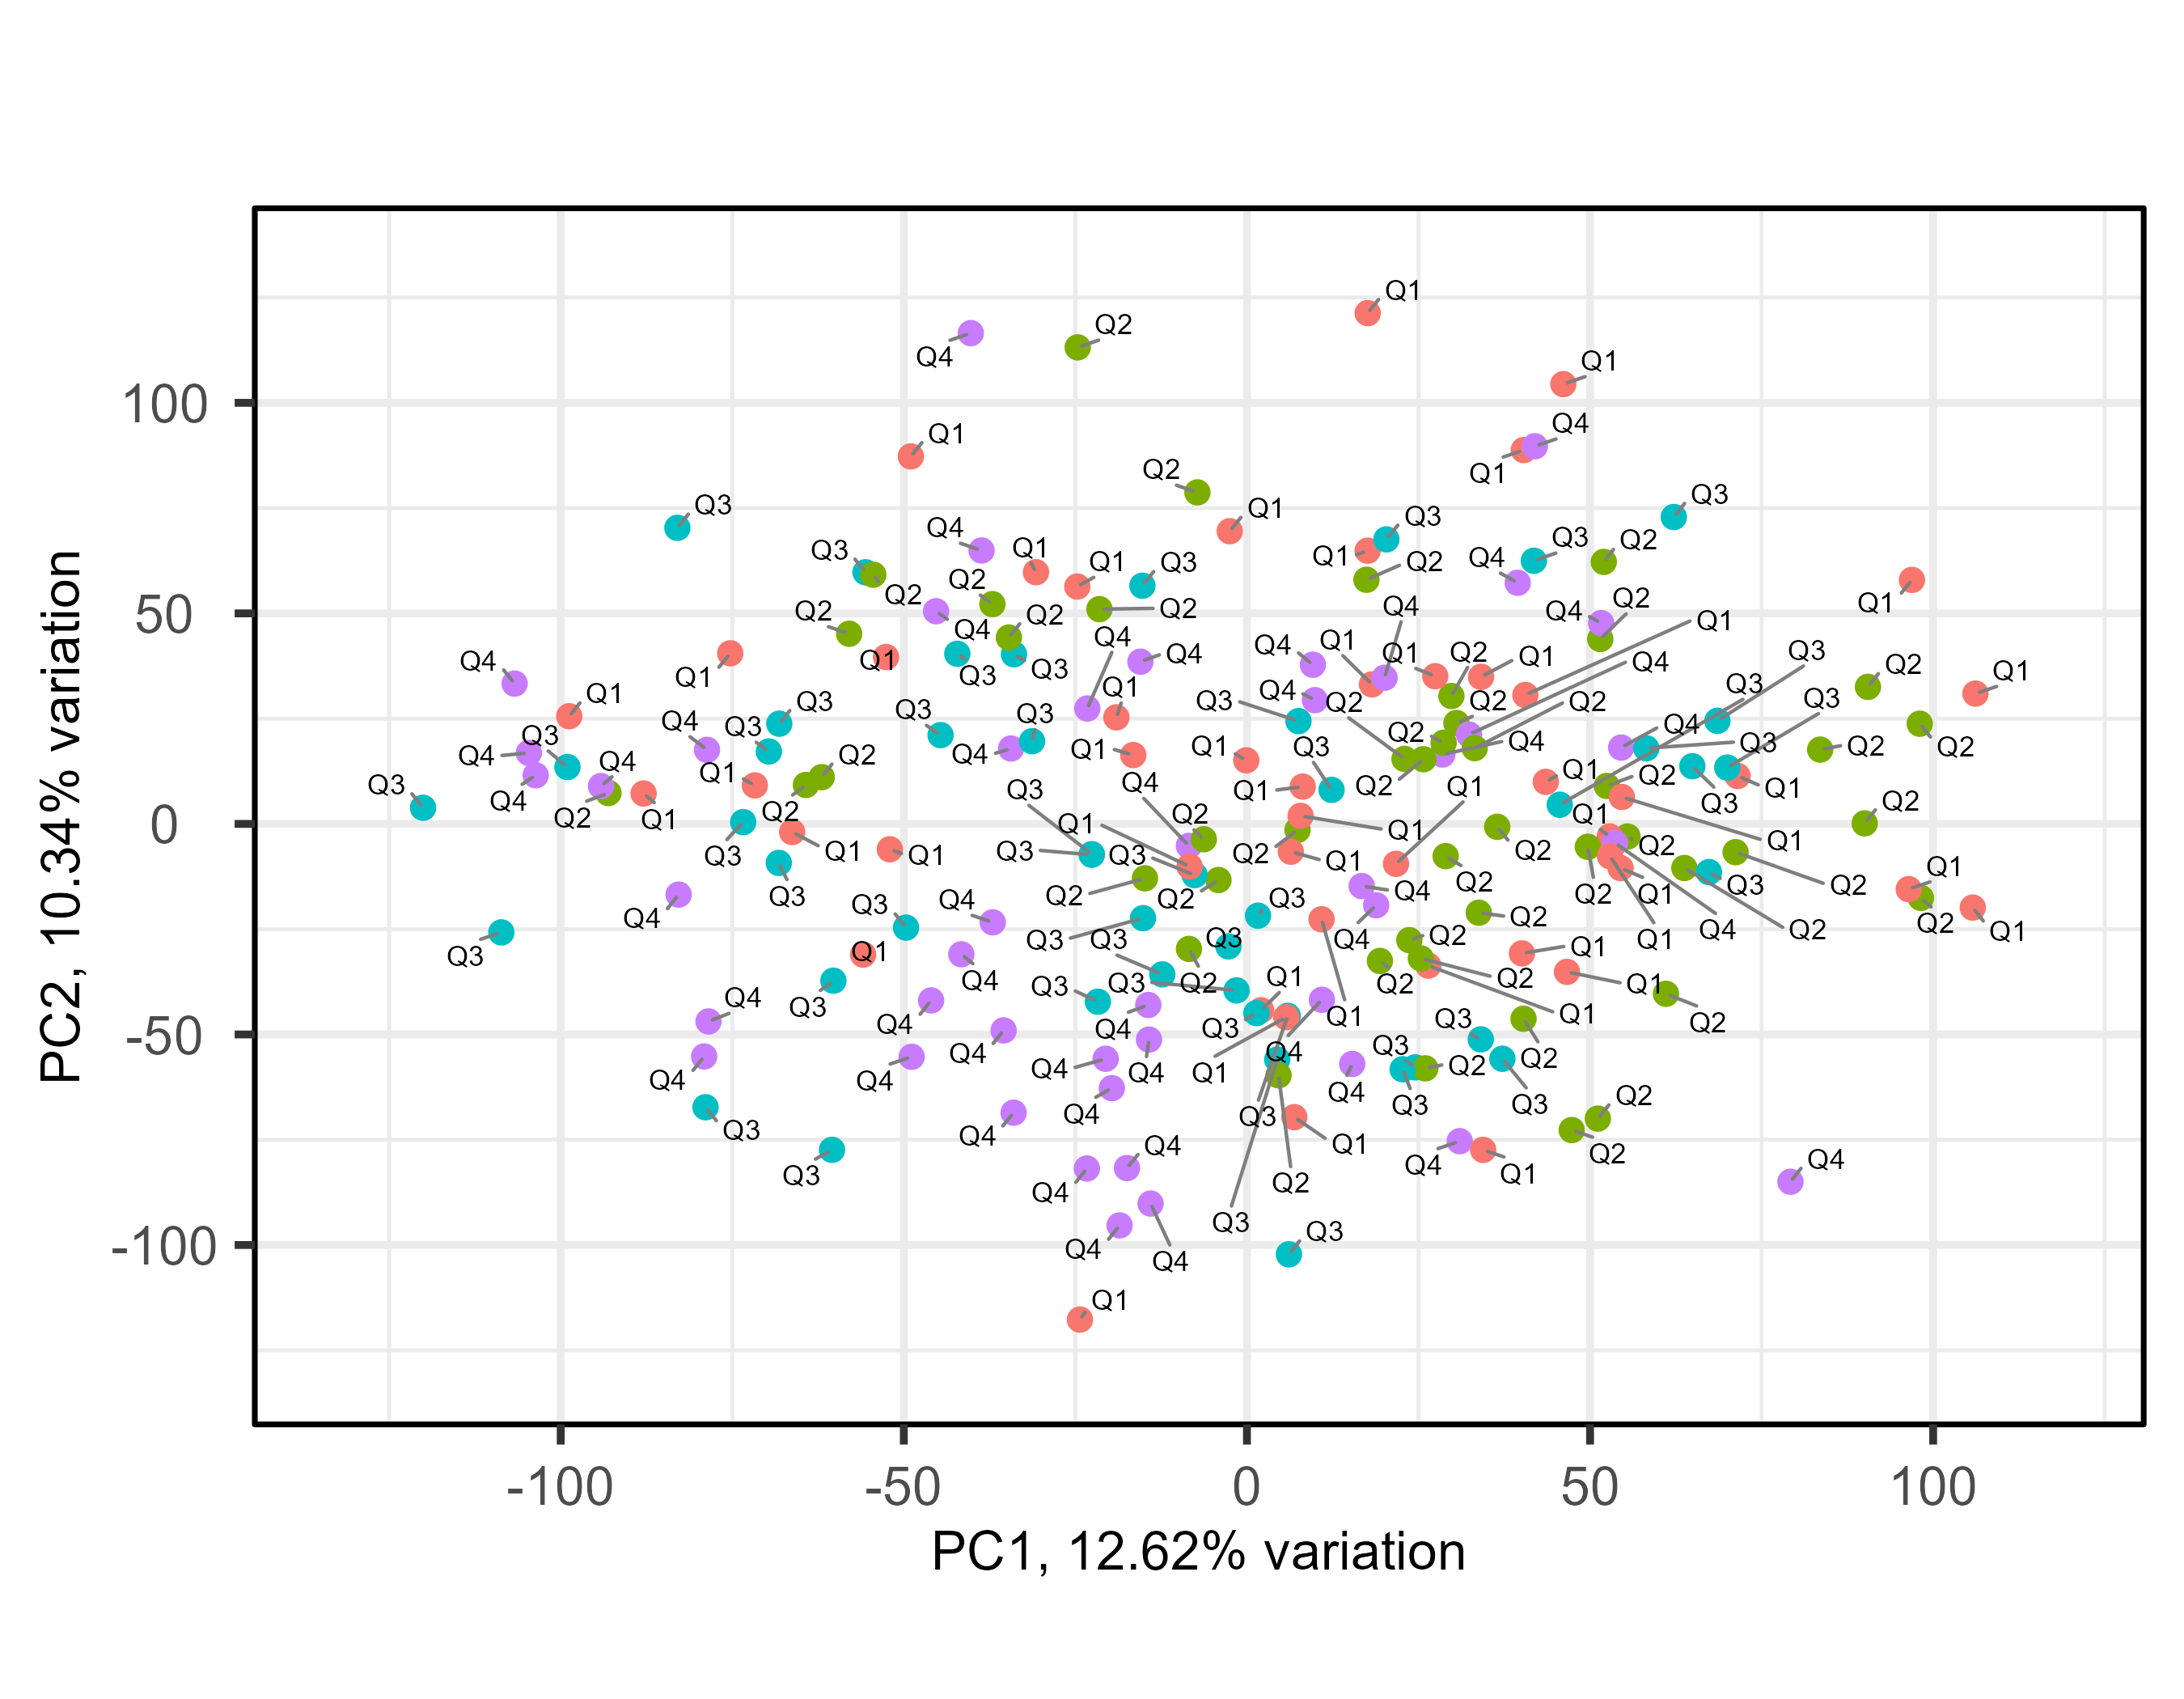
I know both packages use different approaches but is it expected that the result can differ so much? Intriguingly, the x-axis and y-axis descriptions of both approaches seem to report comparable amounts of variations explained by the PCs.
Additionally, where could I begin to learn how to interpret the results from the plotMDS output?

I looked into some other variables and noticed that sex is probably the root cause of this batch effect:
.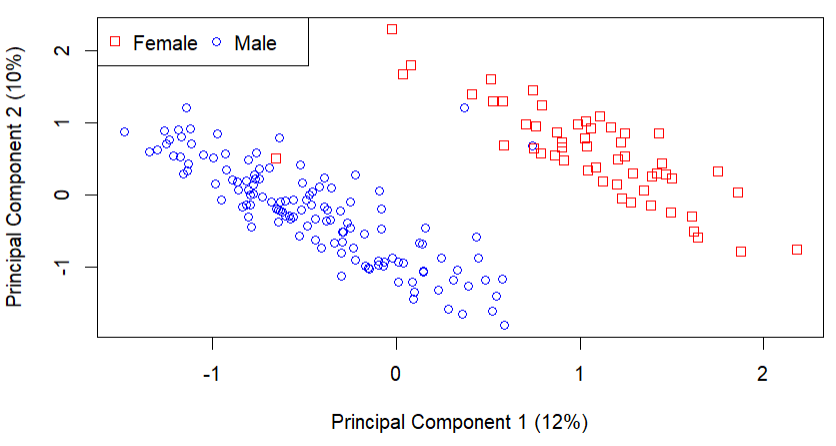
Would it be enough to include it into my design matrix of the experiment and adjust for it or do I have to use limma::removeBatchEffect?
The batch effect is not perfectly aligned with sex, with 3 samples not agreeing. I suggest you investigate the two male samples in the top right and the one female in the lower left. Either these samples are annotated incorrectly, or the batch effect has a different cause that is confounded with gender.
Yes, batch effects are always included in the design matrix. removeBatchEffect is only for graphical exploration (as the help page for removeBatchEffect will tell you).