Abnormal Low Dispersion Gene Population in DESeq2
1
0
Entering edit mode
Aidan • 0
@5499f776
Last seen 18 days ago
United States

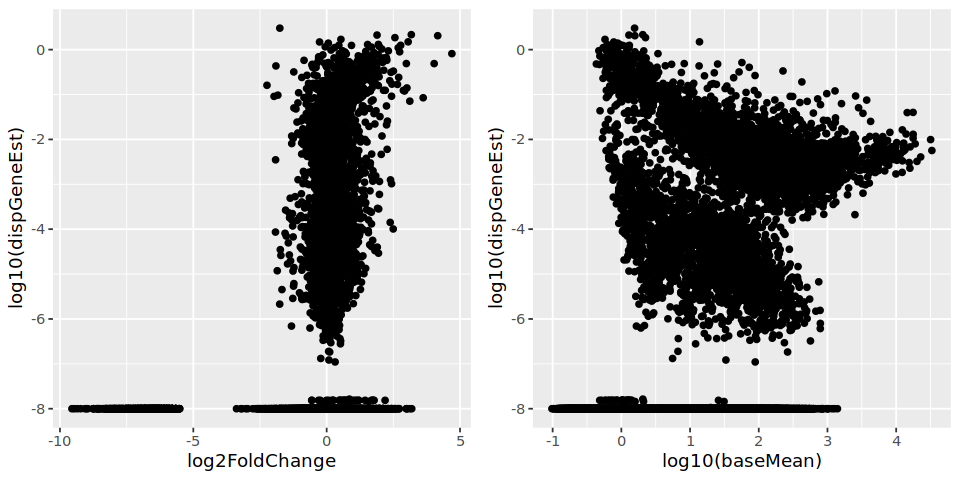
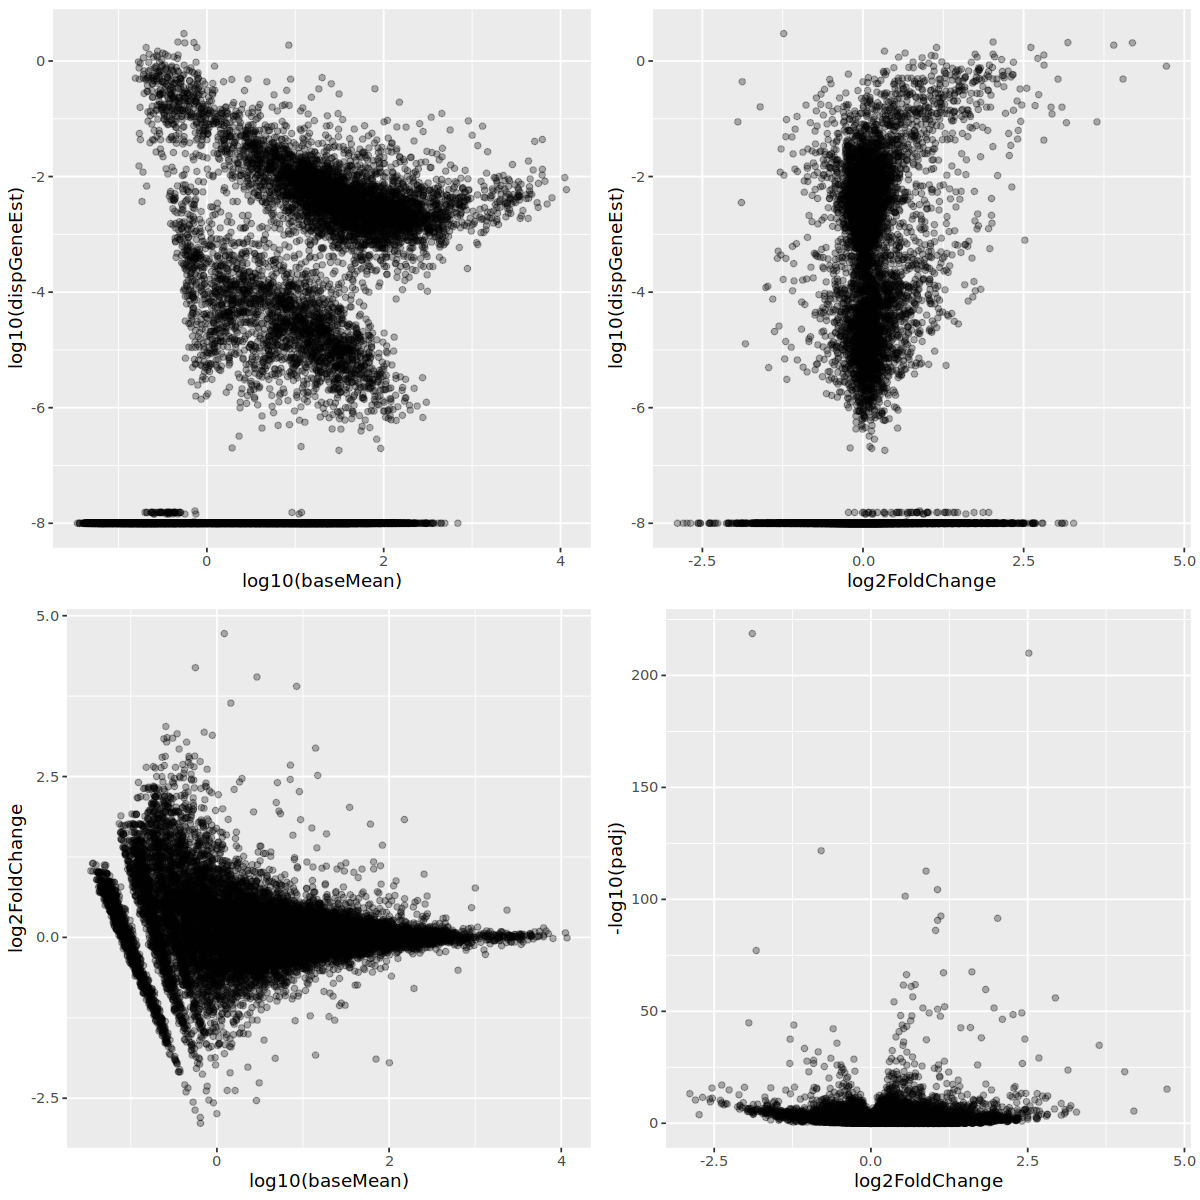
I am seeing a very odd low dispersion group of genes. They seem to be distinct from the minimum dispersion genes that have come up in other questions (What happens to genes with low dispersion during dispersion shrinkage in DESeq2). Has anyone seen anything like this?

I also tend to see a set of genes with inaccurately estimated log2FoldChange. It does not seem to be related to dispersion, however.

For more information?

  • I am using v1.38.0
  • This is on psuedobulk single cell data (~24 samples for treated vs control)
  • I have seen in this in 2 different unrelated datasets
  • I have also seen this in the pyDESeq2 implementation (although I now this is unrelated, I think it may be related to the data itself rather than the implementation)
  • There is no relationship between % of samples expressing a gene and this trend. Filtering to genes that are expressed in half of these genes did not remove them significantly.

dds <- DESeqDataSetFromMatrix(
    countData = t(counts),
    colData = meta,
    design = as.formula(~ perturbation))

register(MulticoreParam(10))
dds <- DESeq(dds, test="LRT", reduced=~1, minmu=0.1) 


plotDispEsts(dds)
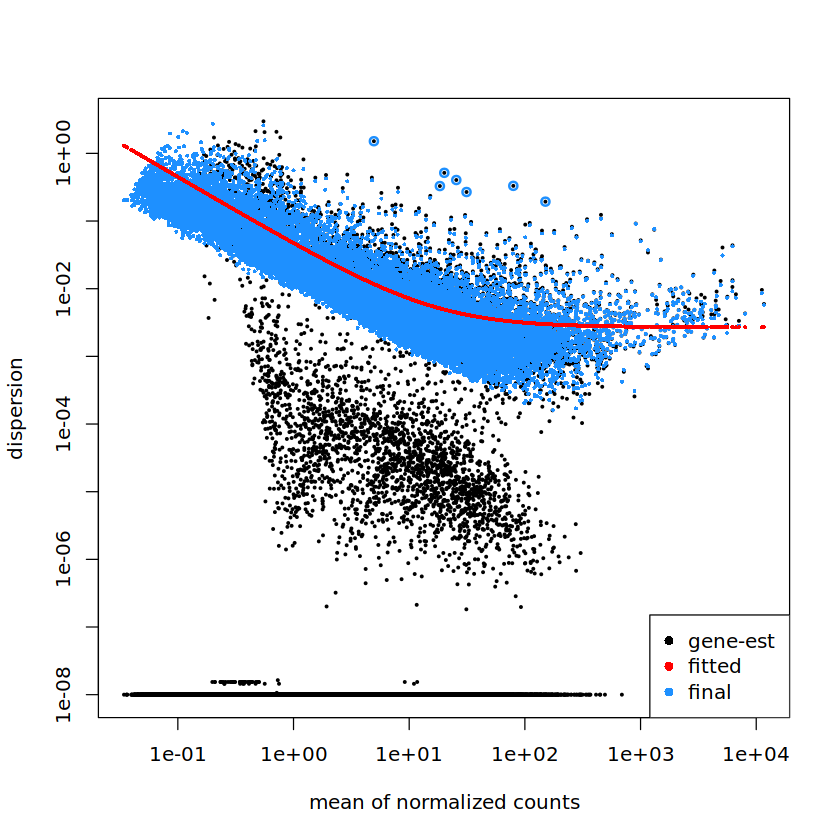
Dispersion Plot Log2FoldChange vs Dispersion

DESeq2 • 241 views
ADD COMMENT
0
Entering edit mode

Thank you in advance!

ADD REPLY
0
Entering edit mode
@mikelove
Last seen 2 hours ago
United States

inaccurately estimated log2FoldChange

You'll have to explain what you mean by this. The LFC is an estimated parameter.

If you want to investigate these genes, one thing is to use plotCounts and pick out some examples genes from both groups of genes.

You can use with(mcols(dds), plot(log10(baseMean), log10(dispGeneEst))) and then with(mcols(dds), identify(...)) with the same arguments.

ADD COMMENT
0
Entering edit mode

Thanks for the quick response!

That is poor wording apologies. I am referring to a set of genes where LFC is estimated to be very large (in this case -10) but that is not indicated looking at the counts. Looking more closely, it seems that is largely dependent on my input parameters (minmu) in those cases. (I mistakenly attached the plot above from a run with minmu=1e-6 and attached here minmu=1e-1 run.) disp_logFC.png

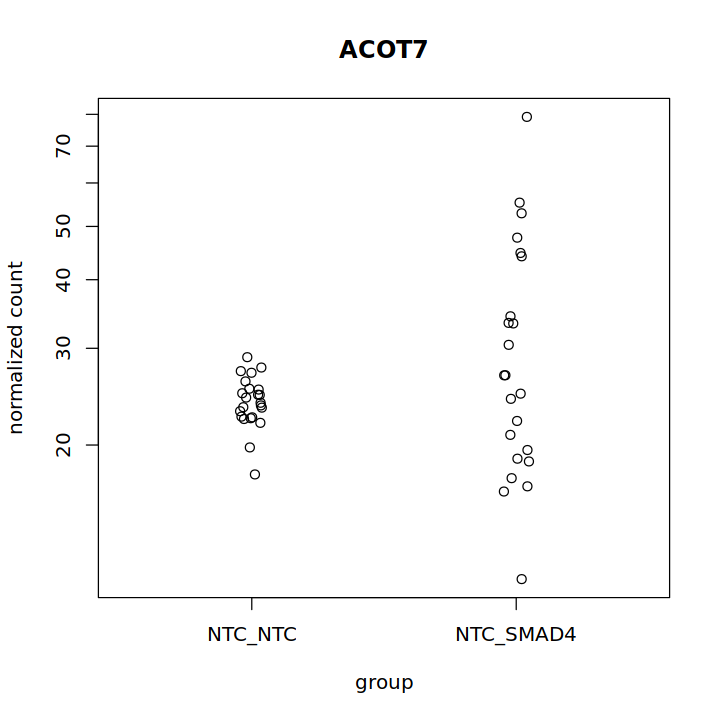
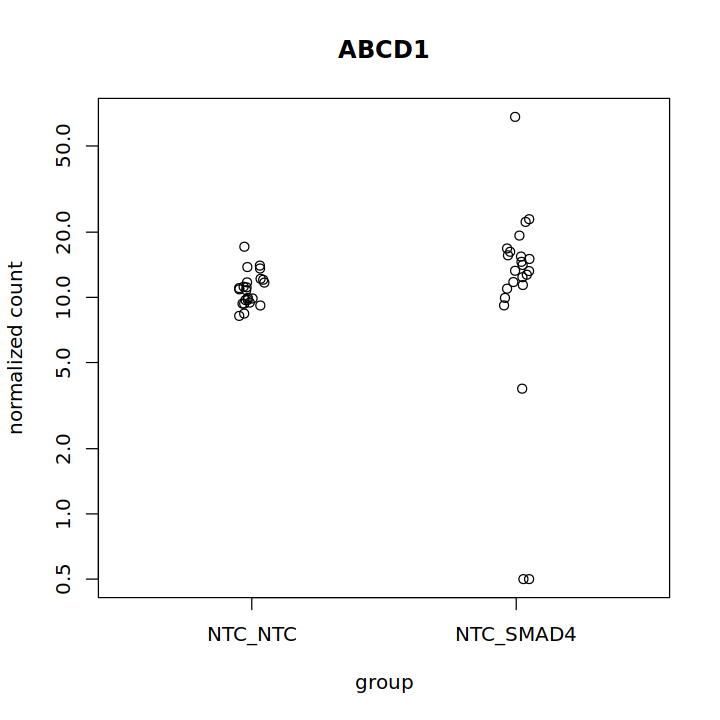
I am mainly curious about this group of genes that has low dispersion separate from the main body of genes. I also attached an example of a few of those genes that below in the "low" dispersion group. gene1 gene 2

Thank you again. Really appreciate the consideration.

ADD REPLY
0
Entering edit mode

That's very interesting. That's quite low dispersion in the NTC group, essentially Poisson, but then overdispersed in SMAD4. There may be some within group variation you could model with something like RUV or SVA.

ADD REPLY

Login before adding your answer.

Traffic: 674 users visited in the last hour
Help About
FAQ
Access RSS
API
Stats

Use of this site constitutes acceptance of our User Agreement and Privacy Policy.

Powered by the version 2.3.6