Entering edit mode

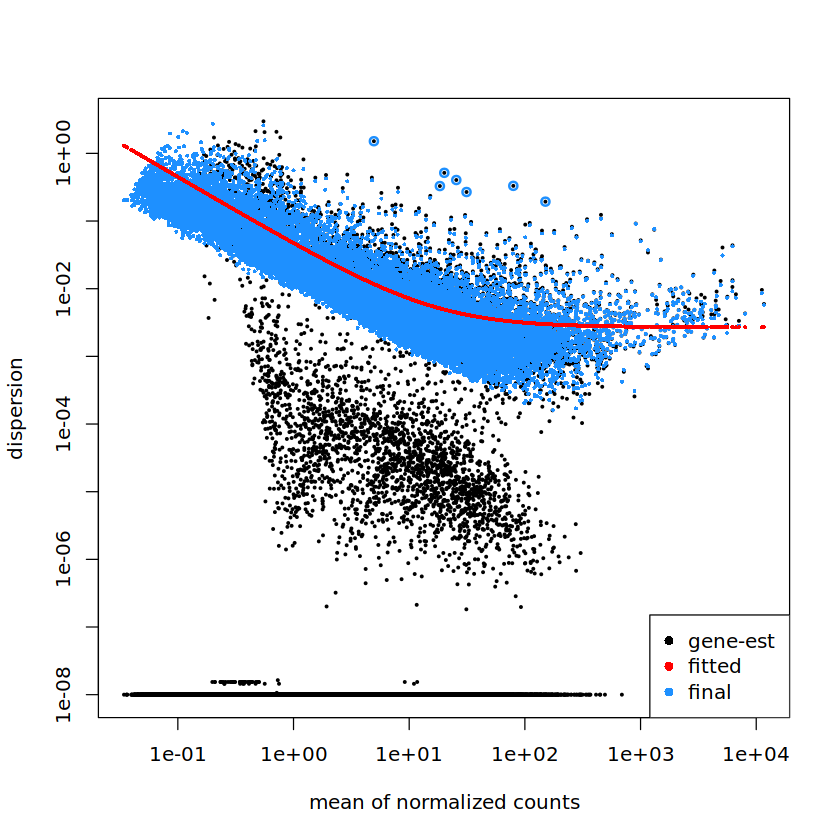
I am seeing a very odd low dispersion group of genes. They seem to be distinct from the minimum dispersion genes that have come up in other questions (What happens to genes with low dispersion during dispersion shrinkage in DESeq2). Has anyone seen anything like this?
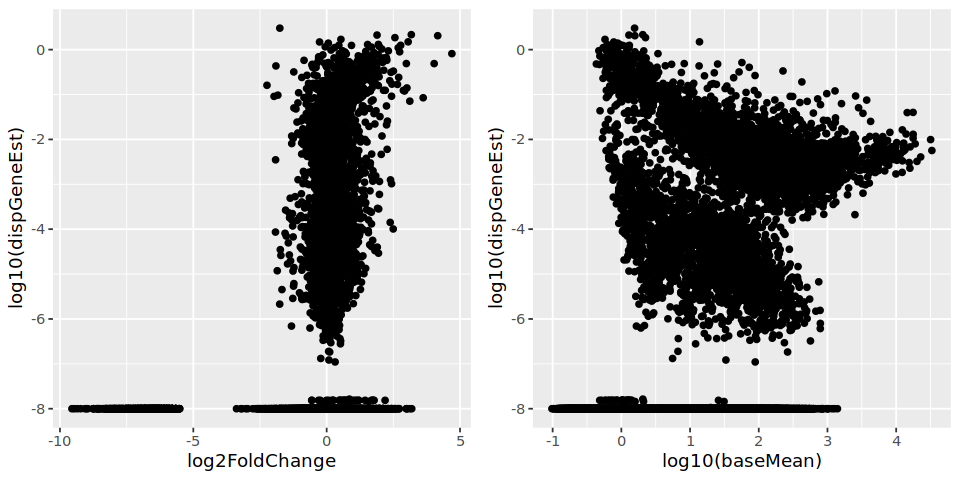
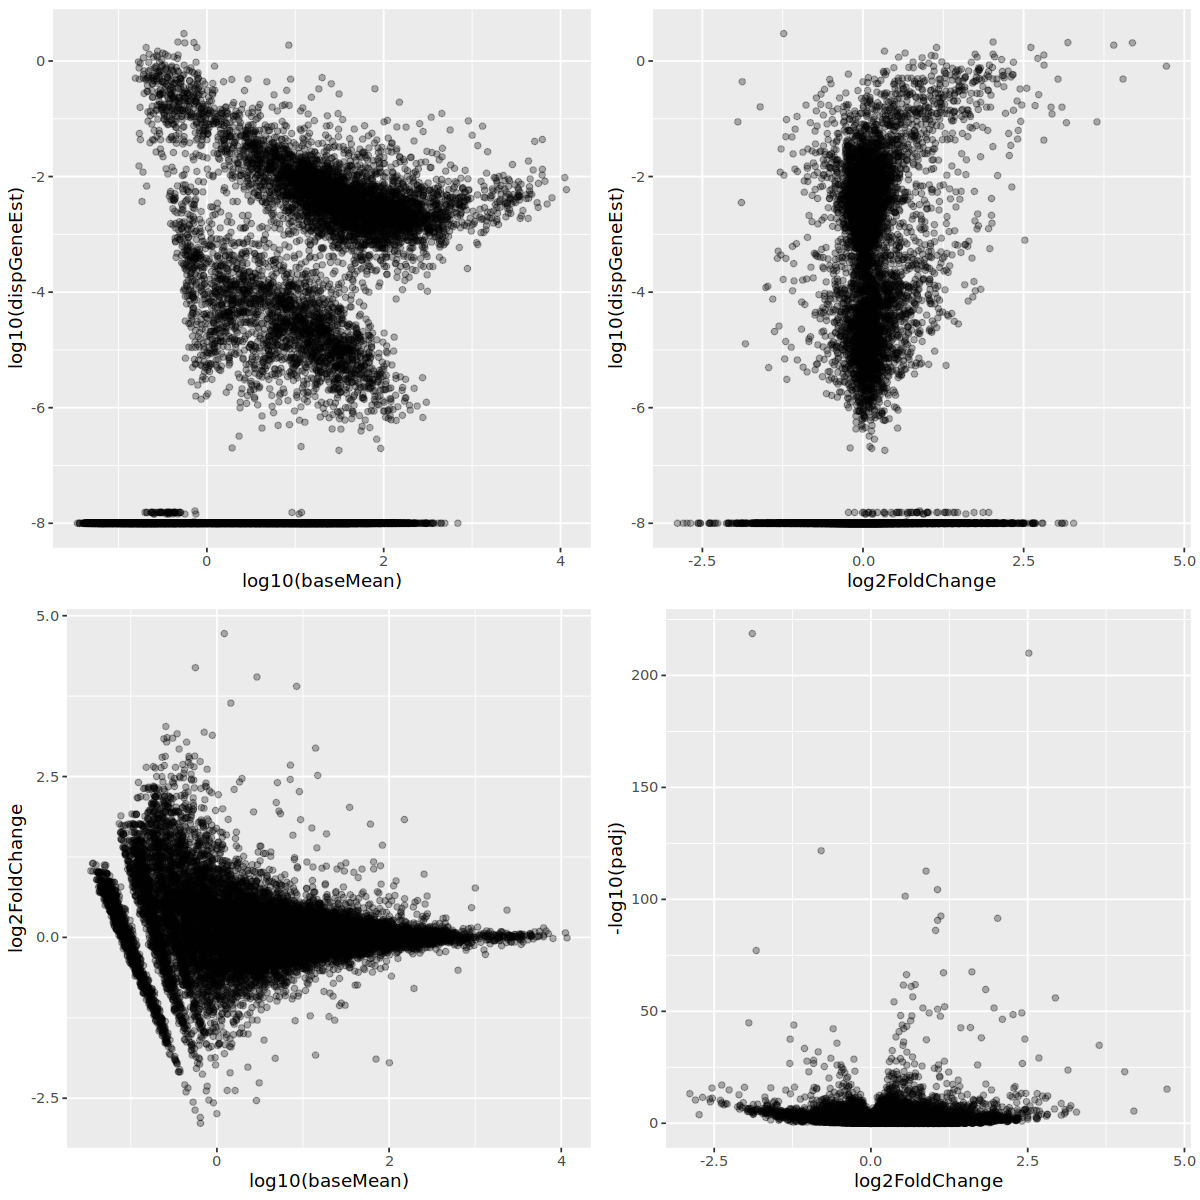
I also tend to see a set of genes with inaccurately estimated log2FoldChange. It does not seem to be related to dispersion, however.
For more information?
- I am using v1.38.0
- This is on psuedobulk single cell data (~24 samples for treated vs control)
- I have seen in this in 2 different unrelated datasets
- I have also seen this in the pyDESeq2 implementation (although I now this is unrelated, I think it may be related to the data itself rather than the implementation)
- There is no relationship between % of samples expressing a gene and this trend. Filtering to genes that are expressed in half of these genes did not remove them significantly.
dds <- DESeqDataSetFromMatrix(
    countData = t(counts),
    colData = meta,
    design = as.formula(~ perturbation))

register(MulticoreParam(10))
dds <- DESeq(dds, test="LRT", reduced=~1, minmu=0.1)


plotDispEsts(dds)

Thank you in advance!