
I am trying to analyze the differential peaks in my ATAC-seq data. I have ATAC-seq analysis on 2 biological conditions with 3 replicates in each condition. Below is my sample info:
         ID Factor Condition Replicate Intervals
1 ATACctrl1  ctrl1      ctrl         1      8654
2 ATACctrl2  ctrl2      ctrl         2      6750
3 ATACctrl3  ctrl3      ctrl         3      5962
4  ATACele1   ele1       ele         1     16863
5  ATACele2   ele2       ele         2     18282
6  ATACele3   ele3       ele         3     16552
After ran DBA_object=dba.count(DBA_object,bUseSummarizeOverlaps=TRUE):
         ID Factor Condition Replicate   Reads FRiP
1 ATACctrl1  ctrl1      ctrl         1 6339729 0.05
2 ATACctrl2  ctrl2      ctrl         2 5314756 0.05
3 ATACctrl3  ctrl3      ctrl         3 3776006 0.05
4  ATACele1   ele1       ele         1 4848142 0.08
5  ATACele2   ele2       ele         2 4215205 0.10
6  ATACele3   ele3       ele         3 4292494 0.09
Then I ran
DBA_object=dba.contrast(DBA_object,categories=DBA_CONDITION,minMembers=3)
DBA_object=dba.analyze(DBA_object,method=DBA_DESEQ2)
and the volcano plot is like
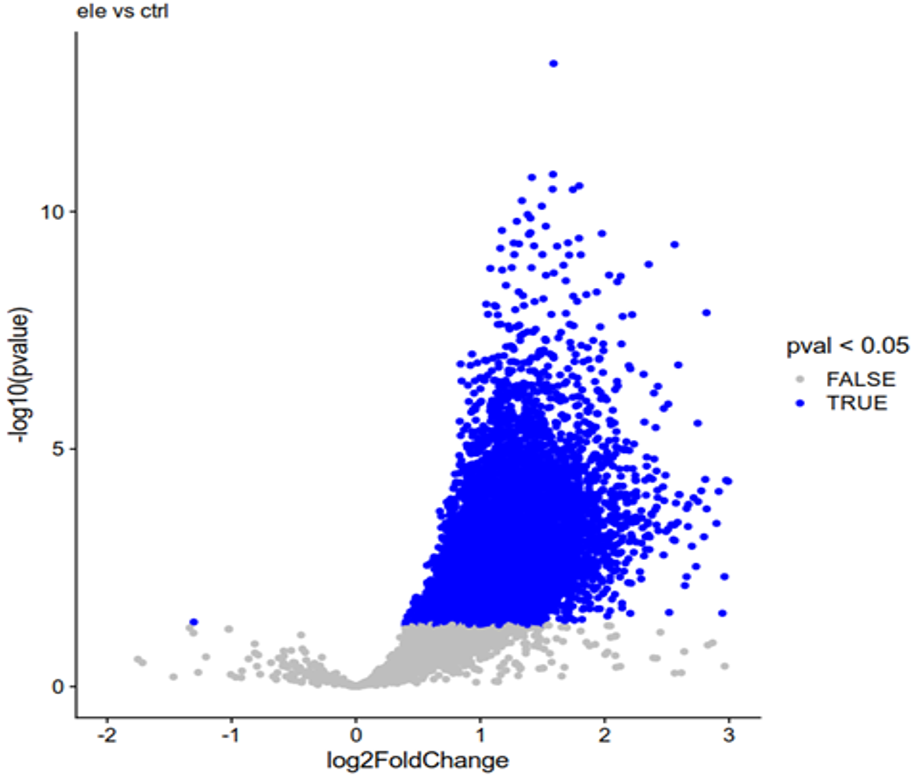
As you can see, there are many more open peaks in the experimental group, while the control group only has a small amount of them. Then I extract the binding matrix using
DBA_object <- dba.count(DBA_object, peaks=NULL, score=DBA_SCORE_READS)
counts <- dba.peakset(myDBA, bRetrieve=TRUE)
Then, I use Deseq2 to analyze the differential peaks using default parameters and I get 124 peaks that is more open in control condition and 221 peaks more open in experimental group. I want to know why there is such a big difference in the results between the two methods, and should I also downsample the samples? Thanks!
Make an MAplot. There is almost certainly an issue with normalization here given the very biased distribution of logFCs as in this Volcano.
Thank you for your suggestions! Here is the MA plot: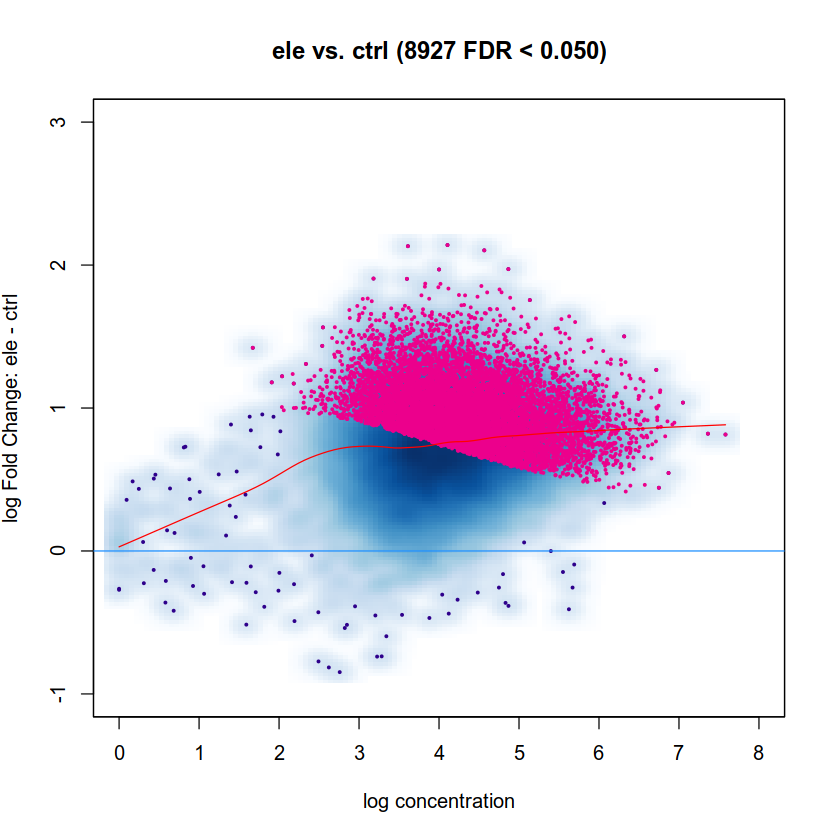
I tried several normalization methods with DiffBind
or
and get almost same result: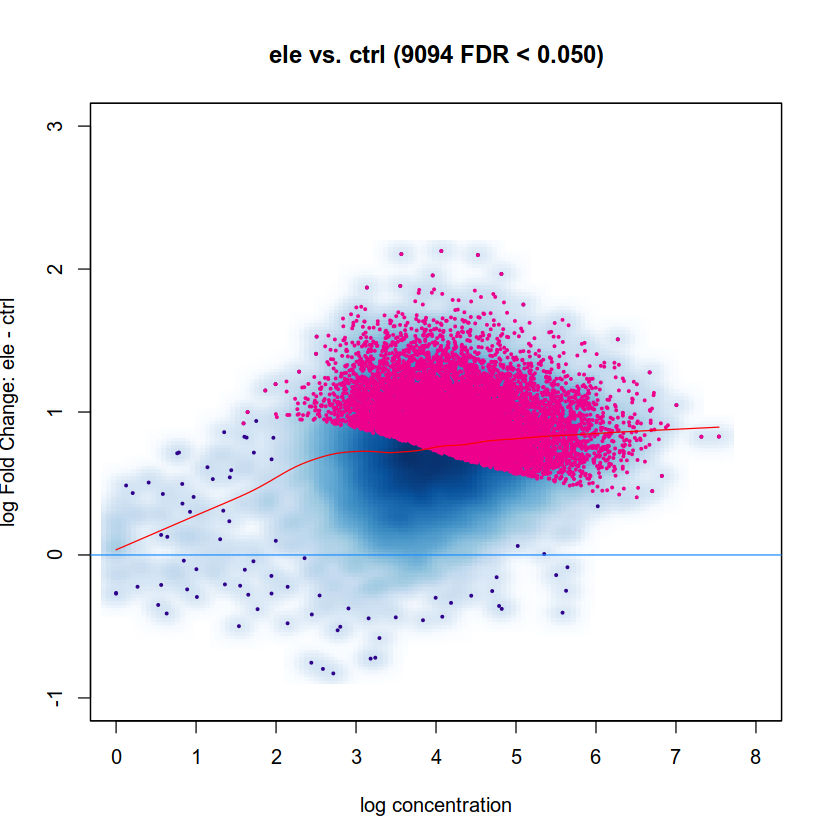
How can I normalize my data? Thank you!
As expected normalization is way off, meaning in simple terms that the cloud is too high. The deep-blue area should be along y=0. Try the default DESeq2 normalization in DiffBind. I am not a DiffBind user myself so I cannot help with code, but it seems to me that your first approach is using background windows which you typically don't want and the second seems to be simple library size normalization which you typically don't want either. Check the docs and use the default normalization from edgeR/DESeq2 depending which you use for testing.
I tried the default normalization and got similar results as above. Perhaps I need to try identifying the difference peak without using diffbind. Thank you again for your answer