Hello everyone, I had posted this question before: DESeq2 output used for PCA plot on R studio
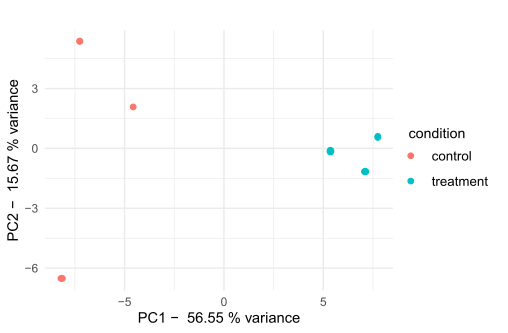
I did my PCA again but on only one study (three control and three treatment conditions), and this is my result. This time, I have studied PCA properly and with the help of tutorials; last time (on my last thread), I took it from a source and did not realize that the data was around.
I have redone the codes, and this is the result I am getting. I wanted your opinion on if it's a good result or not.
I have 8 such studies (I am unable to get the PCA). Is there any other statistical tool that can take in my 4 WT studies and 4 Mutant studies? Each study has a DESeq2 output generated.
Thank you!


cross post: https://www.biostars.org/p/9593486/