Entering edit mode

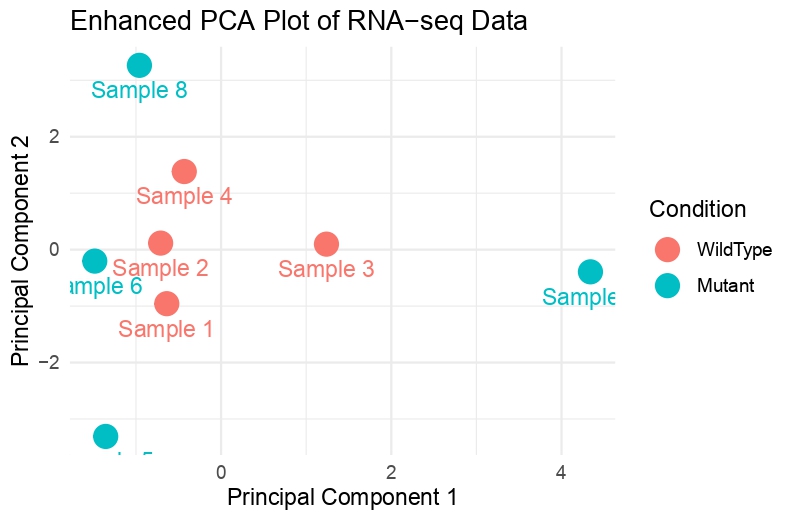
Hello everyone, This is my first time performing DESeq2, and even PCA analysis. I have 8 samples. (4 WT and 4 mutant) I have done PCA Analysis, and this is my output. There is not much variance; what can I conclude from this?
I can see the WT clustering together but the mutant samples are not far apart from each other. I expected the WT samples to cluster together and the mutants to do the same (but on opposite sides)
Someone pls help, I need to present this data in my presentation but I cannot wrap my head around this. Is this bad quality data? What does it say?
The code that I executed is this:
# Load necessary libraries
library(DESeq2)
library(ggplot2)

# Enhance the synthetic count data by increasing the difference
set.seed(123)  # Ensure reproducibility
base_counts <- matrix(sample(500:1000, 100 * 4, replace = TRUE), ncol = 4, nrow = 100)

# Increase variability for mutants: use larger subtractive modifiers
mutant_modifiers <- matrix(sample(300:500, 100 * 4, replace = TRUE), ncol = 4, nrow = 100)
mutant_counts <- pmax(base_counts - mutant_modifiers, 1)  # Ensure no zero counts

# Combine wild type and mutant counts
countData <- cbind(base_counts, mutant_counts)

rownames(countData) <- paste("Gene", 1:100, sep=" ")
colnames(countData) <- paste("Sample", 1:8, sep=" ")

# Create colData with sample information
sampleCondition <- c(rep("WildType", 4), rep("Mutant", 4))
colData <- DataFrame(condition = factor(sampleCondition, levels = c("WildType", "Mutant")))

# Construct DESeq2 dataset
dds <- DESeqDataSetFromMatrix(countData = countData,
                              colData = colData,
                              design = ~ condition)
dds <- DESeq(dds)

# Perform rlog transformation with blind = FALSE to utilize condition information
rld <- rlog(dds, blind = FALSE)

# PCA focusing on increased contrast
pcaData <- prcomp(t(assay(rld)))

# Create data frame for ggplot
pcaResults <- as.data.frame(pcaData$x)
pcaResults$Sample <- rownames(pcaResults)
pcaResults$Condition <- colData$condition

# Plotting the PCA with enhanced contrast
ggplot(pcaResults, aes(x = PC1, y = PC2, color = Condition, label = Sample)) +
  geom_point(size = 5) +
  geom_text(vjust = 2, hjust = 0.5) +
  labs(title = "Enhanced PCA Plot of RNA-seq Data", x = "Principal Component 1", y = "Principal Component 2") +
  theme_minimal()
You are just making up data? What is the point of this exercise?
How am i making the data? I am using the DESeq2 output data which I had generated
I was thinking the same as swbarnes. You're doing some data munging here, but I did not look closely enough to see what this exactly does.
Anyway, what this shows is that generally PC1 separates WT from MUT but there is a MUT outlier. YOu could choose to remove this one to get more DEGs as this drives up variability which might be technical.
This comment helps.
You didn't generate it with an experiment, you made it up:
Your PCA doesn't look like a good RNASeq experiment, because it's not.
I had taken this code from internet, but after reading about it and I did on my own, I would be making a post to ask for the suggestions if it looks good or not :)
This looks terrible for RNASeq data, because it's not RNASeq data. It's a matrix of pretty random numbers, which you know because you posted the code where you made the matrix of random numbers.
Again, what is the point of this exercise?