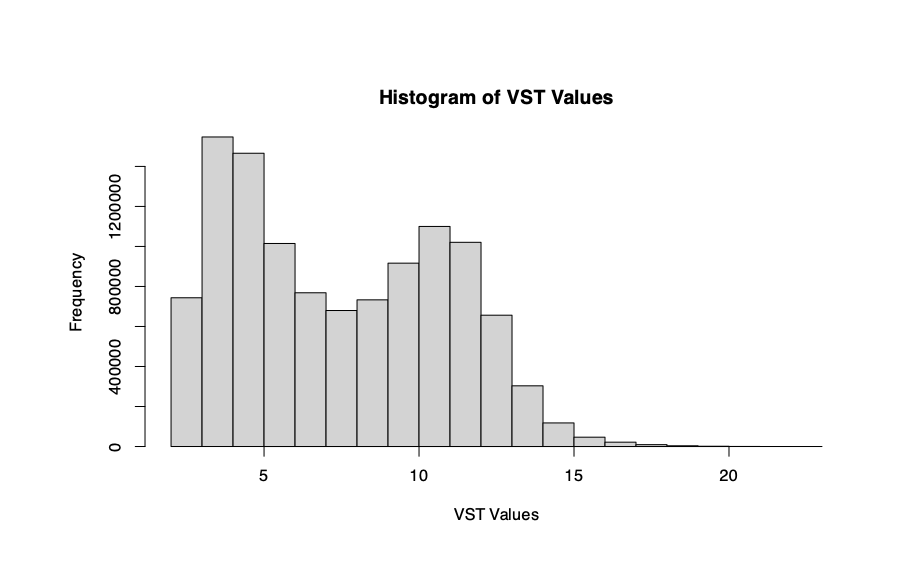
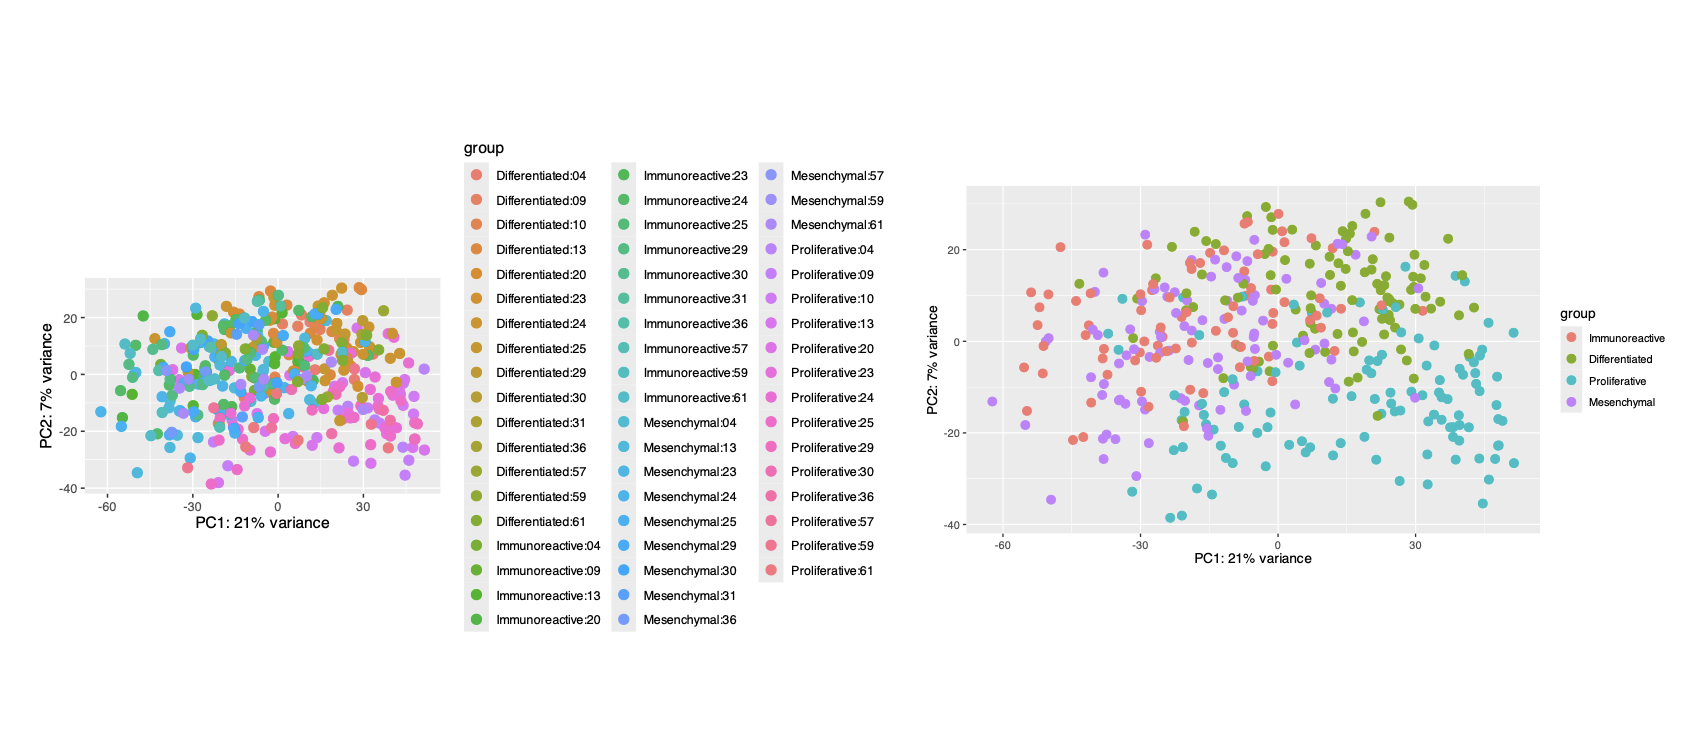
Completed Deseq2, still seeing a bimodal distribution in my RNA sequencing data after normalization on a histogram. I know you always say that one of the "bumps" is relating to noise...however, after looking at my data inside and out...I am not sure how noise could still be there (I looked at my histogram beforehand). I completed several filtering and outlier step beforehand....however, deseq2 did let me know I have 30 outliers after DE. My PCA plot doesn't show any crazy batch effects. I did the VST transformation, that I planned to use for downstream analysis.
PCA:
I am not sure if I am expected to see a unimodal distribution.
Due to the nature of DESeq2 I am not expecting a perfect bell-shaped curve, as it uses raw RNA counts...however, just concerned about this for downstream validity.
There is no expectation of normality that is realistic in terms of expression level. Levels are widely different between genes, and counts are on top of that influenced by mappability of the gene, gene length etc. It looks "normal" in terms of "expected" to me.
Not sure what you mean by "noise", the first "peak" is just genes with low(er) counts.
Noise in terms of expression...to make sure that the information reported is not due to artifacts and actually expression. When I had FPKM data my data had a normal bell shape curve after I did TAMPOR : https://github.com/edammer.


Noise in terms of expression...to make sure that the information reported is not due to artifacts and actually expression. When I had FPKM data my data had a normal bell shape curve after I did TAMPOR : https://github.com/edammer.