Inconsistent nullp and goseq enrichment results across operating systems
2
0
Entering edit mode
Danielle • 0
@6497ad3e
Last seen 6 weeks ago
United States

Hello,

We are trying to find the root issue of why we are having differing final output results from using the same datasets, parameters, functions, R (4.4.1), RStudio ("2024.04.2+764"), and goseq (1.56.0) package versions. Using the code below, I have tried to replicate the results with the exact same cloned repository on multiple computers and operating systems while checking that all steps are identical when running. However, with this code I am receiving 31 significantly enriched terms, while when someone else clones the repository or the code is used on different operating systems we see there are no significantly enriched terms. This is clearly a major issue and we have tried multiple steps to solve the issue as updating all versions to be the same, trying on multiple systems, cloning and recloning the repo, updating the repo and confirming it has been pushed to Github correctly but we have run out of troubleshooting options. Any ideas or help would be much appreciated!

### Generate vector with names of all genes detected in our dataset 
ALL.vector <- c(filtered_Pverr.annot$gene_id)

### Generate length vector for all genes 
LENGTH.vector <- as.integer(filtered_Pverr.annot$length)

### Generate vector with names in just the contrast we are analyzing
ID.vector.down <- DEG.res %>%
filter(direction=="Downregulated") %>%
pull(gene_id)

##Get a list of GO Terms for all genes detected in our dataset 
GO.terms <- filtered_Pverr.annot%>%
dplyr::select(gene_id, GO.ID)

##Format to have one goterm per row with gene ID repeated
split <- strsplit(as.character(GO.terms$GO.ID), ";") 
split2 <- data.frame(v1 = rep.int(GO.terms$gene_id, sapply(split, length)), v2 = unlist(split)) 
colnames(split2) <- c("gene_id", "GO.ID")
GO.terms<-split2

##Construct list of genes with 1 for genes in contrast and 0 for genes not in the contrast
gene.vector.down=as.integer(ALL.vector %in% ID.vector.down) 
names(gene.vector.down)<-ALL.vector#set names

#weight gene vector by bias for length of gene: load in the gene.vector(a list of all genes with 1 indicating it is a DEG in the group of interest and 0 meaning it is not a DEG) and bias.data (list of lengths for all genes)
pwf.down<-nullp(gene.vector.down, bias.data=LENGTH.vector) 
data(genes)
pwf <- nullp(genes, 'hg19', 'ensGene')

#run goseq using Wallenius method for all categories of GO terms: load in the pwf object (gene name, a 1 or 0 to indicate DEG, the length, and the pwf function; generated from pwf above), and the list of GO terms for all genes
GO.wall.down<-goseq(pwf.down, gene2cat=GO.terms, test.cats=c("GO:BP", "GO:MF", "GO:CC"), method="Wallenius", use_genes_without_cat=TRUE)
GO.down <- GO.wall.down[order(GO.wall.down$over_represented_pvalue),]
colnames(GO.down)[1] <- "GOterm"

#adjust p-values 
GO.down$bh_adjust <- p.adjust(GO.down$over_represented_pvalue, method="BH") #add adjusted p-values

#Filtering for p < 0.05
GO.down <- GO.down %>%
dplyr::filter(bh_adjust<0.05) %>%
dplyr::arrange(., ontology, bh_adjust)

Output of data from MacOS Monterey version 12.6.6:

enter image description here

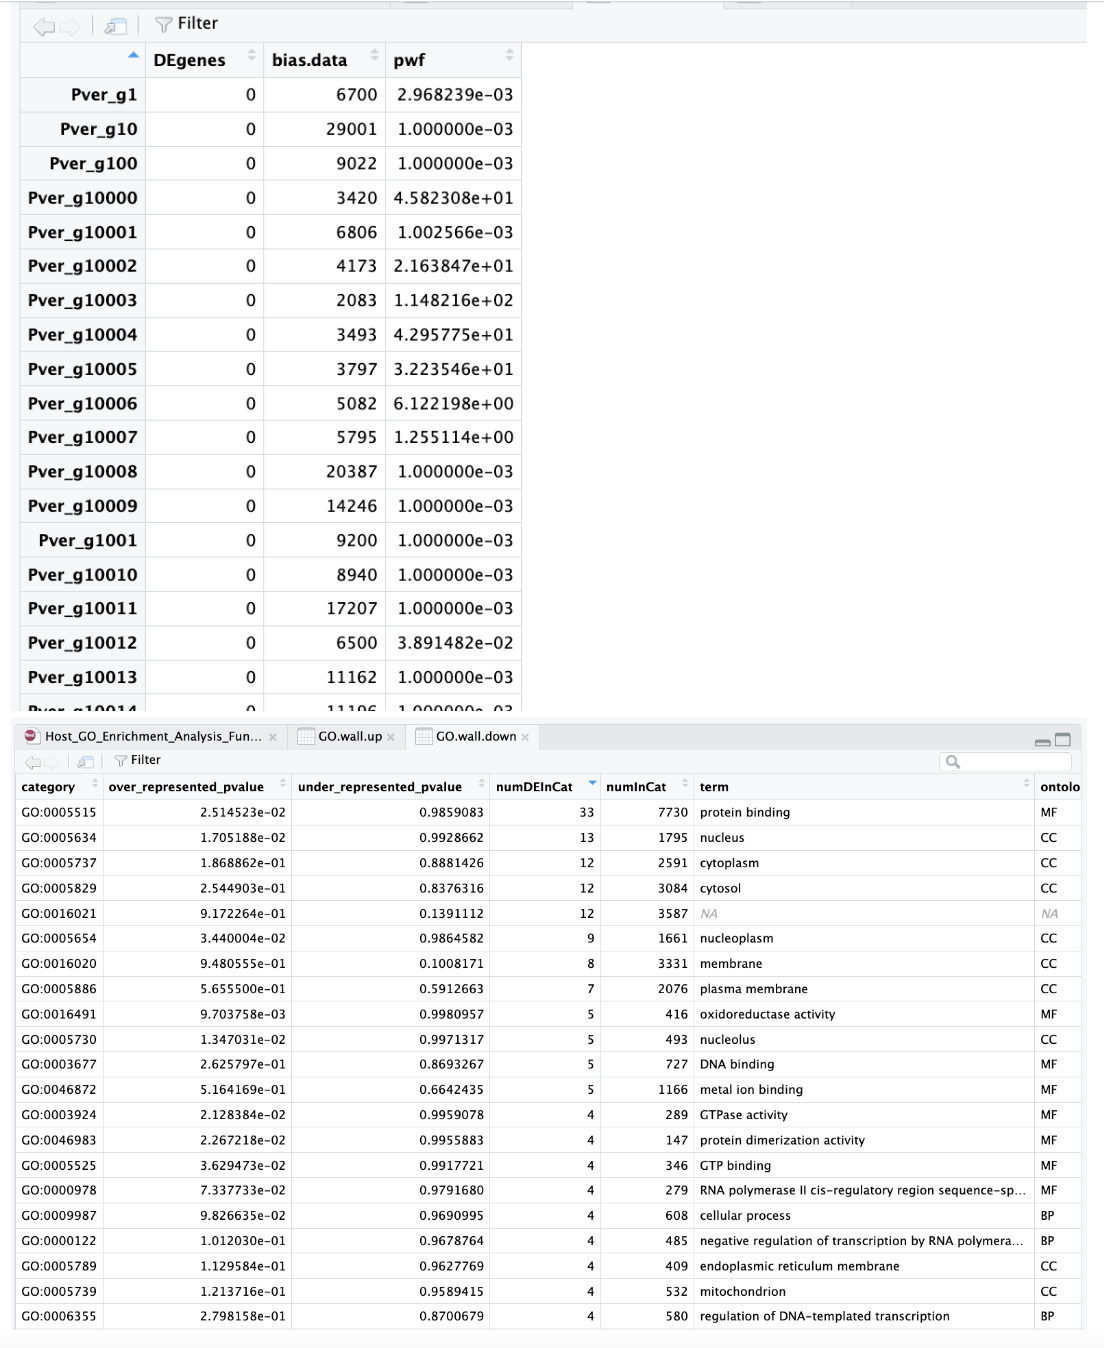
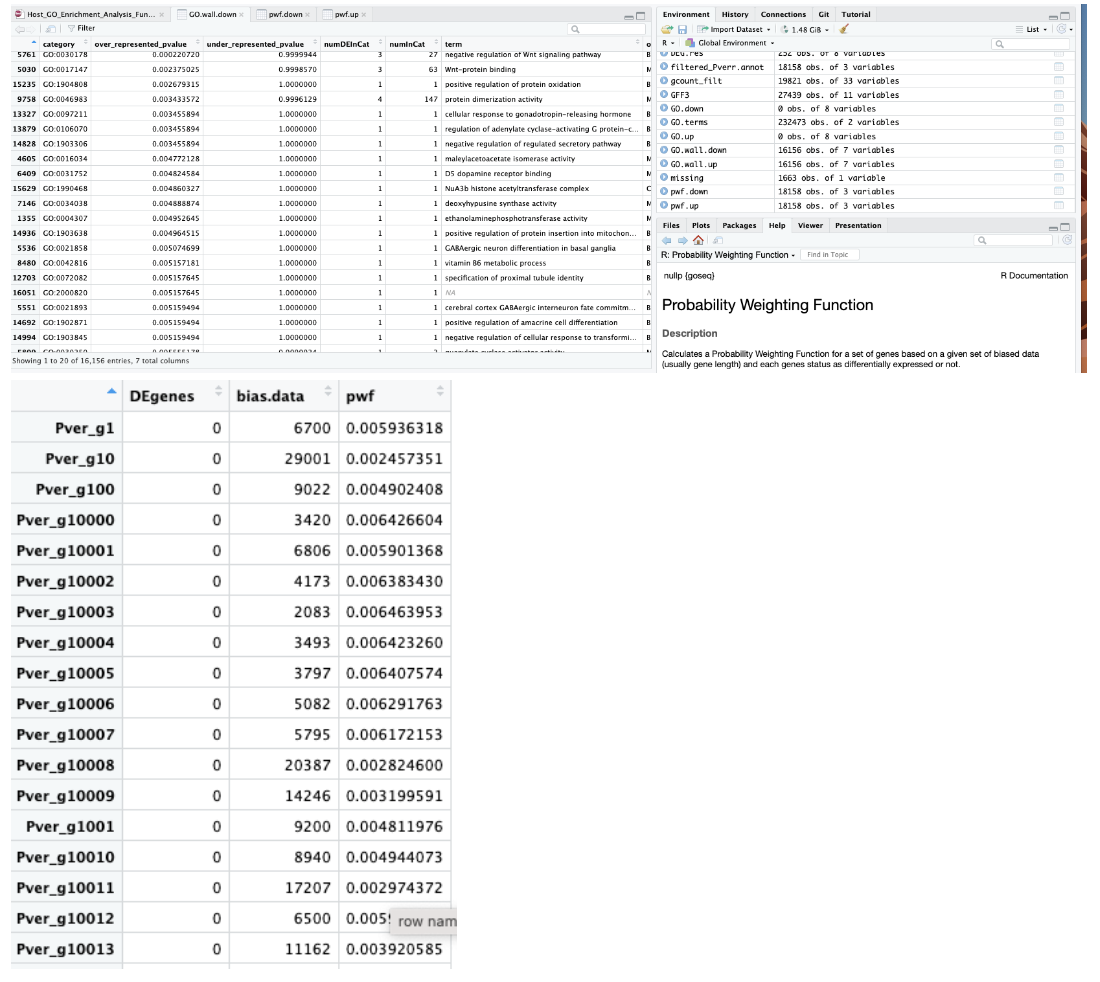
Output of data from macOS Sonoma 14.5:

enter image description here

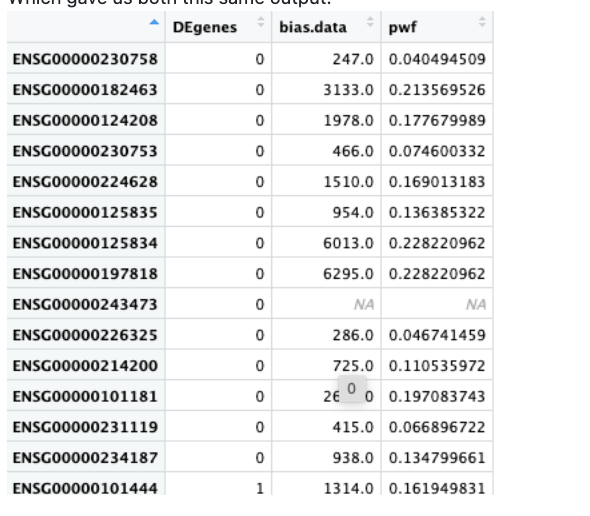
We also both ran a test dataset:

data(genes)
pwf <- nullp(genes, hg19, ensGene)

Which gave us both this same output:

enter image description here

goseq • 1.7k views
ADD COMMENT
2
Entering edit mode
@federico-marini-6465
Last seen 4 weeks ago
Germany

Hi there Danielle, thanks for reporting this.

So far I have to admit that I could not experience such cases where the divergence across OS is that large. Also, I only recently took over the maintenance of goseq, so I might need some time to understand the reason of this happening.

The first thing I can think of, since it happened in other cases when using GO annotations - can you also make sure that the GO.db package and the other ones are also identical across machines? Given the new annotations that can come in, some terms might be reported with different results.

I am not aware of how the RNG works across operating systems, that can also play a role? I am saying this as the number of permutations might stay same, but the actual iterations could differ (albeit we all hope that they don't do substantially...).

My main devel machine is a MacOS one, but I might have access to additional laptops where windows can be on. Would it be ok for you to send me a snippet and the input data (handled confidentially, if needed)?

ADD COMMENT
0
Entering edit mode

Hi Federico,

Thank you for the quick response.

Yes, we made sure that all softwares and updates to packages and R and Rstudio were all the same. Also, between each of us we are using the exact same code and repositories for the data storage and download.

Please feel free to download the data and full repository from GitHub to see what results you get. Here is the GitHub link: https://github.com/hputnam/Becker_E5/blob/master/RAnalysis/Scripts/RNA-seq/Host/Host_GO_Enrichment_Analysis_Func_Annot.Rmd

ADD REPLY
0
Entering edit mode

Hi Danielle, I managed to clone the repo. Thanks for sharing that!

On my machine, MacOS 12.7, I have the following results:

nullp()

> head(pwf.down, 20)
            DEgenes bias.data          pwf
Pver_g1           0      6700 2.968239e-03
Pver_g10          0     29001 1.000000e-03
Pver_g100         0      9022 1.000000e-03
Pver_g10000       0      3420 4.582308e+01
Pver_g10001       0      6806 1.002566e-03
Pver_g10002       0      4173 2.163847e+01
Pver_g10003       0      2083 1.148216e+02
Pver_g10004       0      3493 4.295775e+01
Pver_g10005       0      3797 3.223546e+01
Pver_g10006       0      5082 6.122198e+00
Pver_g10007       0      5795 1.255114e+00
Pver_g10008       0     20387 1.000000e-03
Pver_g10009       0     14246 1.000000e-03
Pver_g1001        0      9200 1.000000e-03
Pver_g10010       0      8940 1.000000e-03
Pver_g10011       0     17207 1.000000e-03
Pver_g10012       0      6500 3.891482e-02
Pver_g10013       0     11162 1.000000e-03
Pver_g10014       0     11196 1.000000e-03
Pver_g10018       0     20987 1.000000e-03

... with a fairly odd shape in the fit plot for the output of nullp() - not something that plateaus nicely "as it should".

Maybe because you don't have so many DE genes?

> table(gene.vector.down)
gene.vector.down
    0     1 
18084    74

So... on the line of your 12.6 setting.

goseq()

Running then goseq() I have this (many lines included to have the negative regulation of Wnt signaling pathway you are showing in the Sonoma output)

> GO.down |> head(35)
          GOterm over_represented_pvalue under_represented_pvalue numDEInCat numInCat                                                                                    term ontology    bh_adjust
15235 GO:1904808            1.406004e-07                1.0000000          1        1                                                positive regulation of protein oxidation       BP 0.0004543081
13327 GO:0097211            1.406004e-07                1.0000000          1        1                                     cellular response to gonadotropin-releasing hormone       BP 0.0004543081
13879 GO:0106070            1.406004e-07                1.0000000          1        1 regulation of adenylate cyclase-activating G protein-coupled receptor signaling pathway       BP 0.0004543081
14828 GO:1903306            1.406004e-07                1.0000000          1        1                                      negative regulation of regulated secretory pathway       BP 0.0004543081
5809  GO:0030250            2.812008e-07                1.0000000          1        2                                                    guanylate cyclase activator activity       MF 0.0004543081
4141  GO:0010856            2.812008e-07                1.0000000          1        2                                                    adenylate cyclase activator activity       MF 0.0004543081
7285  GO:0034455            2.812008e-07                1.0000000          1        2                                                                           t-UTP complex       CC 0.0004543081
5389  GO:0019954            2.812008e-07                1.0000000          1        2                                                                    asexual reproduction       BP 0.0004543081
2741  GO:0006968            2.812008e-07                1.0000000          1        2                                                               cellular defense response       BP 0.0004543081
1205  GO:0003963            2.812008e-07                1.0000000          1        2                                                       RNA-3'-phosphate cyclase activity       MF 0.0004543081
15147 GO:1904515            4.218013e-07                1.0000000          1        3                                                  positive regulation of TORC2 signaling       BP 0.0005242016
6836  GO:0032875            4.218013e-07                1.0000000          1        3                                                     regulation of DNA endoreduplication       BP 0.0005242016
14942 GO:1903669            4.218013e-07                1.0000000          1        3                                          positive regulation of chemorepellent activity       BP 0.0005242016
12408 GO:0071321            7.030022e-07                1.0000000          1        5                                                               cellular response to cGMP       BP 0.0008112645
4605  GO:0016034            2.831665e-06                1.0000000          1        1                                                   maleylacetoacetate isomerase activity       MF 0.0030498919
2506  GO:0006572            3.394066e-06                1.0000000          1        5                                                              tyrosine catabolic process       BP 0.0034271586
6409  GO:0031752            1.875957e-05                1.0000000          1        1                                                            D5 dopamine receptor binding       MF 0.0176007267
5138  GO:0019001            1.960962e-05                1.0000000          1        7                                                               guanyl nucleotide binding       MF 0.0176007267
13946 GO:0110094            2.233378e-05                1.0000000          1        3                                                        polyphosphate-mediated signaling       BP 0.0189907626
1432  GO:0004420            2.614655e-05                1.0000000          1        3                                    hydroxymethylglutaryl-CoA reductase (NADPH) activity       MF 0.0204513870
4576  GO:0015936            2.670895e-05                1.0000000          1        7                                                            coenzyme A metabolic process       BP 0.0204513870
2908  GO:0007266            2.784913e-05                1.0000000          1       16                                                         Rho protein signal transduction       BP 0.0204513870
4517  GO:0015804            2.935031e-05                1.0000000          1        8                                                            neutral amino acid transport       BP 0.0206166806
15629 GO:1990468            4.671097e-05                1.0000000          1        1                                                 NuA3b histone acetyltransferase complex       CC 0.0284552419
15628 GO:1990467            4.685157e-05                1.0000000          1        2                                                 NuA3a histone acetyltransferase complex       CC 0.0284552419
12204 GO:0070776            4.727337e-05                1.0000000          1        5                                              MOZ/MORF histone acetyltransferase complex       CC 0.0284552419
8896  GO:0044154            4.755456e-05                1.0000000          1        7                                                                                    <NA>     <NA> 0.0284552419
8870  GO:0043983            5.158693e-05                1.0000000          1        6                                                                                    <NA>     <NA> 0.0297656577
4093  GO:0010762            7.809498e-05                1.0000000          1        5                                                      regulation of fibroblast migration       BP 0.0435069852
7146  GO:0034038            8.644355e-05                1.0000000          1        1                                                         deoxyhypusine synthase activity       MF 0.0451243081
3418  GO:0008612            8.658415e-05                1.0000000          1        2                                       peptidyl-lysine modification to peptidyl-hypusine       BP 0.0451243081
5761  GO:0030178            1.576891e-04                0.9999964          3       27                                            negative regulation of Wnt signaling pathway       BP 0.0796132674
16059 GO:2000850            2.392371e-04                1.0000000          1        3                                         negative regulation of glucocorticoid secretion       BP 0.1048922722
9330  GO:0045744            2.395183e-04                1.0000000          1        5                     negative regulation of G protein-coupled receptor signaling pathway       BP 0.1048922722
15892 GO:2000323            2.395183e-04                1.0000000          1        5                        negative regulation of glucocorticoid receptor signaling pathway       BP 0.1048922722

The output of GO.down you are showing for Monterey can probably not be in sync with your screenshots. I am expecting that if the overrepresented p value is not that small, upon correction this should just be filtered out - and here you are showing me some (fairly generic) hits (protein binding, cytosol, ...).

All in all my output seems to resemble more the Sonoma-flavored analysis. And this, even if my pwf looked more... monterey-like.

--> I am kinda confused myself with the mix-up of results.

Can you try to run an alternative method on this very dataset, provided it fits with the custom gene-go annotation you need to provide? It can be that clusterProfiler can support that, not too sure if topGO can also cover this for you (I think so, but have no experience on such flavors).

Sorry I could not get to the solution, but maybe it can point you to an alternative at least? I agree that the differences are at least... odd to see.

HTH,

Federico

ADD REPLY
0
Entering edit mode

For completeness, this is my machine now:

> sessionInfo()
R version 4.4.0 (2024-04-24)
Platform: x86_64-apple-darwin20
Running under: macOS Monterey 12.7.1

Matrix products: default
BLAS:   /System/Library/Frameworks/Accelerate.framework/Versions/A/Frameworks/vecLib.framework/Versions/A/libBLAS.dylib 
LAPACK: /Library/Frameworks/R.framework/Versions/4.4-x86_64/Resources/lib/libRlapack.dylib;  LAPACK version 3.12.0

locale:
[1] en_US.UTF-8/en_US.UTF-8/en_US.UTF-8/C/en_US.UTF-8/en_US.UTF-8

time zone: Europe/Berlin
tzcode source: internal

attached base packages:
[1] grid      stats4    stats     graphics  grDevices utils     datasets  methods   base     

other attached packages:
 [1] org.Ce.eg.db_3.19.1         rrvgo_1.16.0                data.table_1.15.4           GSEABase_1.66.0            
 [5] graph_1.82.0                annotate_1.82.0             XML_3.99-0.16.1             AnnotationDbi_1.66.0       
 [9] VennDiagram_1.7.3           futile.logger_1.4.3         DataCombine_0.2.21          clusterProfiler_4.12.0     
[13] gridExtra_2.3               goseq_1.57.3                geneLenDataBase_1.41.2      BiasedUrn_2.0.12           
[17] adegenet_2.1.10             ade4_1.7-22                 patchwork_1.2.0             spdep_1.3-5                
[21] sf_1.0-16                   spData_2.3.1                limma_3.60.3                gplots_3.1.3.1             
[25] genefilter_1.86.0           RColorBrewer_1.1-3          pheatmap_1.0.12             lubridate_1.9.3            
[29] forcats_1.0.0               stringr_1.5.1               dplyr_1.1.4                 purrr_1.0.2                
[33] readr_2.1.5                 tidyr_1.3.1                 tibble_3.2.1                ggplot2_3.5.1              
[37] tidyverse_2.0.0             DESeq2_1.44.0               SummarizedExperiment_1.34.0 Biobase_2.64.0             
[41] MatrixGenerics_1.16.0       matrixStats_1.3.0           GenomicRanges_1.56.1        GenomeInfoDb_1.40.1        
[45] IRanges_2.38.0              S4Vectors_0.42.0            BiocGenerics_0.50.0        

loaded via a namespace (and not attached):
  [1] fs_1.6.4                 bitops_1.0-7             enrichplot_1.24.0        HDO.db_0.99.1           
  [5] httr_1.4.7               tools_4.4.0              utf8_1.2.4               R6_2.5.1                
  [9] vegan_2.6-6.1            lazyeval_0.2.2           mgcv_1.9-1               permute_0.9-7           
 [13] withr_3.0.0              sp_2.1-4                 prettyunits_1.2.0        archive_1.1.8           
 [17] cli_3.6.2                formatR_1.14             scatterpie_0.2.3         slam_0.1-50             
 [21] tm_0.7-13                askpass_1.2.0            proxy_0.4-27             Rsamtools_2.20.0        
 [25] yulab.utils_0.1.4        gson_0.1.0               txdbmaker_1.0.0          DOSE_3.30.1             
 [29] sessioninfo_1.2.2        rstudioapi_0.16.0        RSQLite_2.3.7            treemap_2.4-4           
 [33] generics_0.1.3           gridGraphics_0.5-1       BiocIO_1.14.0            vroom_1.6.5             
 [37] gtools_3.9.5             GO.db_3.19.1             Matrix_1.7-0             fansi_1.0.6             
 [41] abind_1.4-5              lifecycle_1.0.4          yaml_2.3.8               qvalue_2.36.0           
 [45] SparseArray_1.4.8        BiocFileCache_2.12.0     blob_1.2.4               promises_1.3.0          
 [49] crayon_1.5.3             lattice_0.22-6           cowplot_1.1.3            GenomicFeatures_1.57.0  
 [53] KEGGREST_1.44.1          pillar_1.9.0             knitr_1.47               fgsea_1.30.0            
 [57] rjson_0.2.21             boot_1.3-30              codetools_0.2-20         fastmatch_1.1-4         
 [61] wk_0.9.1                 glue_1.7.0               ggfun_0.1.5              vctrs_0.6.5             
 [65] png_0.1-8                treeio_1.28.0            gtable_0.3.5             cachem_1.1.0            
 [69] xfun_0.45                S4Arrays_1.4.1           mime_0.12                tidygraph_1.3.1         
 [73] survival_3.7-0           units_0.8-5              statmod_1.5.0            nlme_3.1-165            
 [77] ggtree_3.12.0            bit64_4.0.5              progress_1.2.3           filelock_1.0.3          
 [81] KernSmooth_2.23-24       colorspace_2.1-0         DBI_1.2.3                tidyselect_1.2.1        
 [85] bit_4.0.5                compiler_4.4.0           curl_5.2.1               httr2_1.0.1             
 [89] NLP_0.2-1                xml2_1.3.6               DelayedArray_0.30.1      shadowtext_0.1.3        
 [93] rtracklayer_1.64.0       scales_1.3.0             caTools_1.18.2           classInt_0.4-10         
 [97] rappdirs_0.3.3           digest_0.6.35            rmarkdown_2.27           XVector_0.44.0          
[101] htmltools_0.5.8.1        pkgconfig_2.0.3          umap_0.2.10.0            dbplyr_2.5.0            
[105] fastmap_1.2.0            rlang_1.1.4              UCSC.utils_1.0.0         shiny_1.8.1.1           
[109] farver_2.1.2             jsonlite_1.8.8           BiocParallel_1.38.0      GOSemSim_2.30.0         
[113] RCurl_1.98-1.14          magrittr_2.0.3           GenomeInfoDbData_1.2.12  ggplotify_0.1.2         
[117] wordcloud_2.6            s2_1.1.6                 munsell_0.5.1            Rcpp_1.0.12             
[121] reticulate_1.38.0        ape_5.8                  viridis_0.6.5            stringi_1.8.4           
[125] ggraph_2.2.1             zlibbioc_1.50.0          MASS_7.3-61              plyr_1.8.9              
[129] parallel_4.4.0           ggrepel_0.9.5            deldir_2.0-4             Biostrings_2.72.1       
[133] graphlayouts_1.1.1       splines_4.4.0            hms_1.1.3                locfit_1.5-9.9          
[137] igraph_2.0.3             seqinr_4.2-36            reshape2_1.4.4           biomaRt_2.60.0          
[141] futile.options_1.0.1     evaluate_0.24.0          BiocManager_1.30.23      lambda.r_1.2.4          
[145] tzdb_0.4.0               tweenr_2.0.3             httpuv_1.6.15            openssl_2.2.0           
[149] polyclip_1.10-6          gridBase_0.4-7           ggforce_0.4.2            xtable_1.8-4            
[153] restfulr_0.0.15          RSpectra_0.16-1          e1071_1.7-14             tidytree_0.4.6          
[157] later_1.3.2              viridisLite_0.4.2        class_7.3-22             aplot_0.2.3             
[161] memoise_2.0.1            GenomicAlignments_1.40.0 cluster_2.1.6            timechange_0.3.0

... which is basically the latest release + the devel version of goseq

ADD REPLY
0
Entering edit mode

Hi Federico,

Thank you for running that on your machine. You did get consistent results with my dataset when I ran it but that is because we both had run this on the same machine. I think the larger issue that still needs to be solved with goseq and its functions is that this is not consistent when run on a different machine. Which is very concerning when data analyses and the results we publish need to be reproducible for anyone that moves forward or has used goseq for enrichment analyses in the past. We are looking into a non-model organism (coral) which has not been available for clusterProfiler or topGO in the past but I can look further into these alternative options. Please let me know if you think anything can be amended in goseq to address these issues.

ADD REPLY
1
Entering edit mode

I might be too less aware of the internals - especially regarding the ones in cases where there seems to be not too much as DE to have a "good estimate" of the length bias relationship (too few points in the bins, I fear).

But you are right - the odd and worrisome thing is the change of behavior across OS versions (at least, this is what I got with mine). It could be interesting to replicate this on a recent MacOS version. I'll see around a bit if someone with a recent enough version of that could chime in.

ADD REPLY
2
Entering edit mode
@gordon-smyth
Last seen 1 hour ago
WEHI, Melbourne, Australia

Hi Danielle,

I was co-author of the goseq statistical method and of the original goseq publication, although I'm not an author of the software. The limma functions kegga() and goana() provide a different implementation of the goseq idea, just put covariate=GeneLength when you run those functions. They are more robust than goseq itself in terms of the signficance trend when the number of DE genes is small and they give consistent results on all platforms. Perhaps they might help you out in this case.

ADD COMMENT
0
Entering edit mode

Thank you for your proposed solution, Gordon Smyth - I did not know that goana and kegga had that feature (alt-)implemented

I hope this solves the OP problem in a pragmatical way.
Still: is it right to think that the culprit is somewhere in nullp where the spline-making process is not really 1:1 identical across systems?

ADD REPLY

Login before adding your answer.

Traffic: 586 users visited in the last hour
Help About
FAQ
Access RSS
API
Stats

Use of this site constitutes acceptance of our User Agreement and Privacy Policy.

Powered by the version 2.3.6