
Hi all! I am using bacterial RNASeq data for DGE analysis. We are comparing gene expression in Ecoli cells that are treated with lethal concentration of ampicillin for different time periods (3h, 6h, 24h) vs. cells without ampicillin (0h). The control cells (without ampicillin) are log-phase, actively-growing cells. The amp-treated cells are persister cells that survive antibiotic treatment. We suspect there is a global shift in gene expression between the two conditions and I struggle with how to normalize the counts to make it comparable across samples.
Traditionally, the lab has been using DESeq2 for DGE, which uses median of ratio for normalization. As I understood, it's based on the assumption that most of the genes are not DE genes. so I worry that our case violates this assumption and would make the normalization not comparable across treatment.
I looked into smooth quantile normalization (qsmooth) from hicks et al 2018, which allows differences in gene expression distribution. However the paper did not mention what to do after normalization. I don't know which DGE package to use (DESeq2, limma, etc) with the normalized counts. I saw one paper (Shao et al 2024) where they used qsmooth for normalization and fed the normalized counts to limma. However, it did not offer great details. And the limma user guide states that raw counts instead of normalized counts should be used as input to limma. So I am not sure if it's OK to use normalized counts and if so how to do that correctly.
So my questions are:
What is the recommended way to normalize the counts when there is global gene expression change? Which DGE package should I use?
Any one has experience with qsmooth? How do I use the normalized counts for downstream DGE analysis?
I tried to use raw counts as input to limma (see code below), which I believe uses TMM for normalization. Is TMM a suitable way in my case?
x <- DGEList(data)
x$samples$group <- sampletype

# filter low count genes
keep.exprs <- filterByExpr(x, group=sampletype)
x <- x[keep.exprs, keep.lib.siz=FALSE]

# normalization using TMM
x <- calcNormFactors(x, method='TMM')

design <- model.matrix(~0+sampletype)
colnames(design) <- gsub('sampletype', 'T', colnames(design))

contr.matrix <- makeContrasts(
  T0hvsT3h = T0h - T3h,
  T0hvsT6h = T0h - T6h,
  T0hvsT24h = T0h - T24h,
  T3hvsT6h = T3h - T6h,
  T3hvsT24h = T3h-T24h,
  T6hvsT24h = T6h - T24h,
  levels = colnames(design))

v <- voom(x, design, plot=TRUE)
vfit <- lmFit(v, design)
vfit <- contrasts.fit(vfit, contrasts=contr.matrix)
efit <- eBayes(vfit)

sessionInfo( )

R version 4.4.0 (2024-04-24 ucrt)
Platform: x86_64-w64-mingw32/x64
Running under: Windows 10 x64 (build 19045)

Matrix products: default


locale:
[1] LC_COLLATE=English_United States.utf8  LC_CTYPE=English_United States.utf8
[3] LC_MONETARY=English_United States.utf8 LC_NUMERIC=C
[5] LC_TIME=English_United States.utf8

time zone: America/Chicago
tzcode source: internal

attached base packages:
[1] parallel  stats4    stats     graphics  grDevices utils     datasets  methods
[9] base

other attached packages:
 [1] doParallel_1.0.17           iterators_1.0.14            foreach_1.5.2
 [4] ggrepel_0.9.5               tximport_1.32.0             DEGreport_1.40.1
 [7] pheatmap_1.0.12             RColorBrewer_1.1-3          lubridate_1.9.3
[10] forcats_1.0.0               stringr_1.5.1               dplyr_1.1.4
[13] purrr_1.0.2                 readr_2.1.5                 tidyr_1.3.1
[16] tibble_3.2.1                ggplot2_3.5.1               tidyverse_2.0.0
[19] DESeq2_1.44.0               SummarizedExperiment_1.34.0 Biobase_2.64.0
[22] MatrixGenerics_1.16.0       matrixStats_1.3.0           GenomicRanges_1.56.1
[25] GenomeInfoDb_1.40.1         IRanges_2.38.1              S4Vectors_0.42.1
[28] BiocGenerics_0.50.0         quantro_1.38.0              qsmooth_1.20.0
[31] edgeR_4.2.1                 limma_3.60.4

loaded via a namespace (and not attached):
  [1] splines_4.4.0               BiocIO_1.14.0               bitops_1.0-7
  [4] preprocessCore_1.66.0       XML_3.99-0.17               rpart_4.1.23
  [7] lifecycle_1.0.4             lattice_0.22-6              MASS_7.3-60.2
 [10] base64_2.0.1                scrime_1.3.5                backports_1.5.0
 [13] magrittr_2.0.3              minfi_1.50.0                Hmisc_5.1-3
 [16] rmarkdown_2.27              yaml_2.3.10                 doRNG_1.8.6
 [19] askpass_1.2.0               cowplot_1.1.3               DBI_1.2.3
 [22] ConsensusClusterPlus_1.68.0 abind_1.4-5                 zlibbioc_1.50.0
 [25] quadprog_1.5-8              RCurl_1.98-1.16             nnet_7.3-19
 [28] sva_3.52.0                  circlize_0.4.16             GenomeInfoDbData_1.2.12
 [31] genefilter_1.86.0           annotate_1.82.0             DelayedMatrixStats_1.26.0
 [34] codetools_0.2-20            DelayedArray_0.30.1         xml2_1.3.6
 [37] shape_1.4.6.1               tidyselect_1.2.1            UCSC.utils_1.0.0
 [40] beanplot_1.3.1              base64enc_0.1-3             illuminaio_0.46.0
 [43] GenomicAlignments_1.40.0    jsonlite_1.8.8              GetoptLong_1.0.5
 [46] multtest_2.60.0             Formula_1.2-5               survival_3.5-8
 [49] tools_4.4.0                 Rcpp_1.0.12                 glue_1.7.0
 [52] mnormt_2.1.1                gridExtra_2.3               SparseArray_1.4.8
 [55] xfun_0.46                   mgcv_1.9-1                  HDF5Array_1.32.1
 [58] withr_3.0.0                 fastmap_1.2.0               rhdf5filters_1.16.0
 [61] fansi_1.0.6                 openssl_2.2.0               digest_0.6.35
 [64] timechange_0.3.0            R6_2.5.1                    colorspace_2.1-0
 [67] RSQLite_2.3.7               utf8_1.2.4                  generics_0.1.3
 [70] data.table_1.15.4           rtracklayer_1.64.0          httr_1.4.7
 [73] htmlwidgets_1.6.4           S4Arrays_1.4.1              pkgconfig_2.0.3
 [76] gtable_0.3.5                blob_1.2.4                  ComplexHeatmap_2.20.0
 [79] siggenes_1.78.0             XVector_0.44.0              htmltools_0.5.8.1
 [82] clue_0.3-65                 logging_0.10-108            scales_1.3.0
 [85] png_0.1-8                   ggdendro_0.2.0              knitr_1.48
 [88] rstudioapi_0.16.0           tzdb_0.4.0                  rjson_0.2.21
 [91] checkmate_2.3.2             nlme_3.1-164                curl_5.2.1
 [94] bumphunter_1.46.0           GlobalOptions_0.1.2         cachem_1.1.0
 [97] rhdf5_2.48.0                foreign_0.8-86              AnnotationDbi_1.66.0
[100] restfulr_0.0.15             GEOquery_2.72.0             pillar_1.9.0
[103] grid_4.4.0                  reshape_0.8.9               vctrs_0.6.5
[106] xtable_1.8-4                cluster_2.1.6               htmlTable_2.4.3
[109] evaluate_0.24.0             GenomicFeatures_1.56.0      cli_3.6.2
[112] locfit_1.5-9.10             compiler_4.4.0              Rsamtools_2.20.0
[115] rlang_1.1.4                 crayon_1.5.3                rngtools_1.5.2
[118] nor1mix_1.3-3               mclust_6.1.1                plyr_1.8.9
[121] psych_2.4.6.26              stringi_1.8.4               BiocParallel_1.38.0
[124] munsell_0.5.1               Biostrings_2.72.1           Matrix_1.7-0
[127] hms_1.1.3                   sparseMatrixStats_1.16.0    bit64_4.0.5
[130] Rhdf5lib_1.26.0             KEGGREST_1.44.1             statmod_1.5.0
[133] broom_1.0.6                 memoise_2.0.1               bit_4.0.5
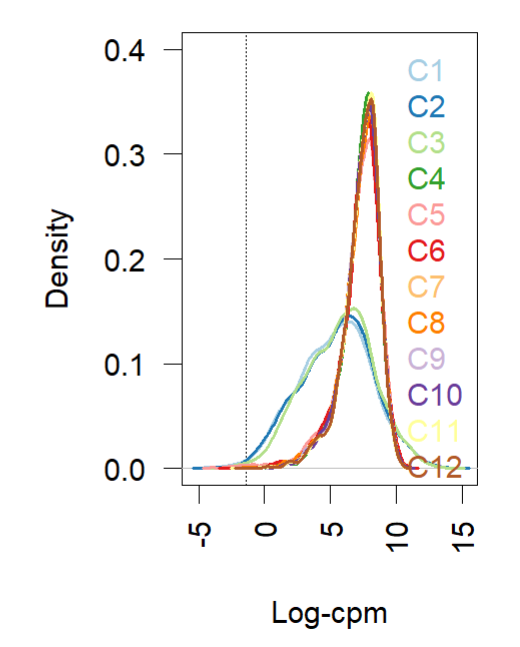
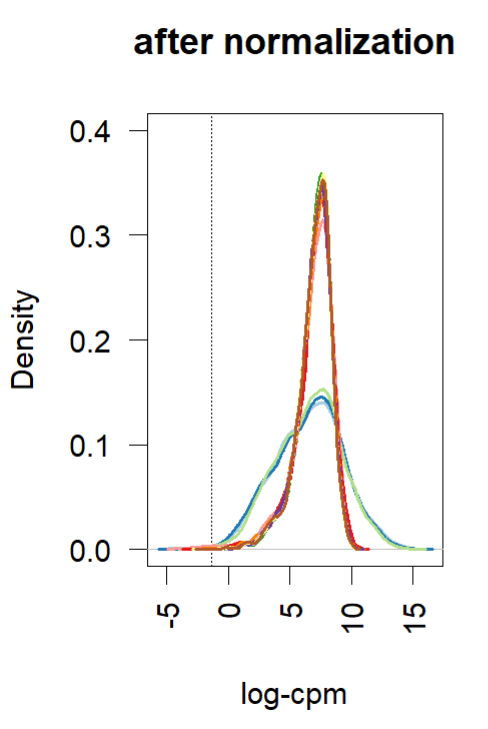
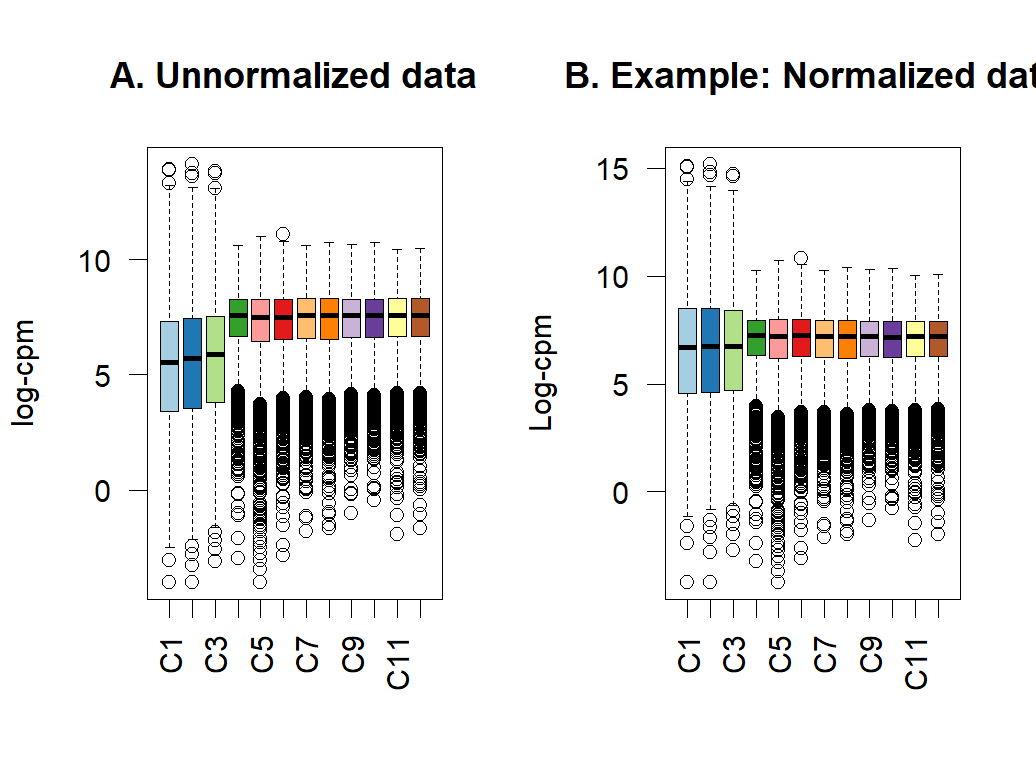
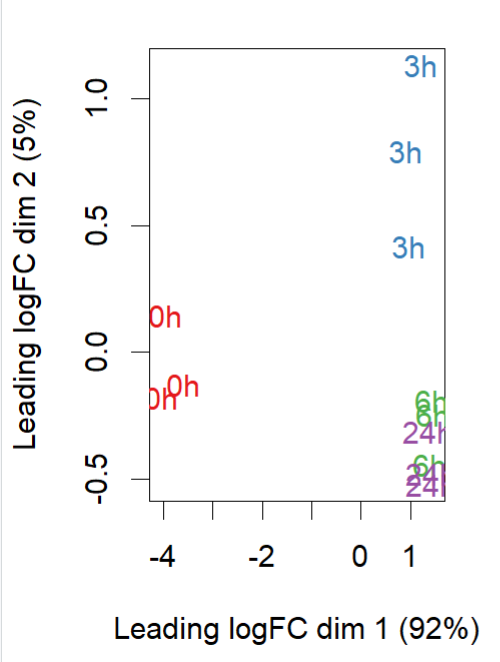
Data explorative analysis:
- Density plot (before and after normalization using TMM (edgR and limma). Short and wide are the control samples(no amp), tall and skinny are amp treated for different lengths of time.
- boxplot of before and after normalization
- MDS plot ((0h is control, 3h, 6h and 24h are amp treated)
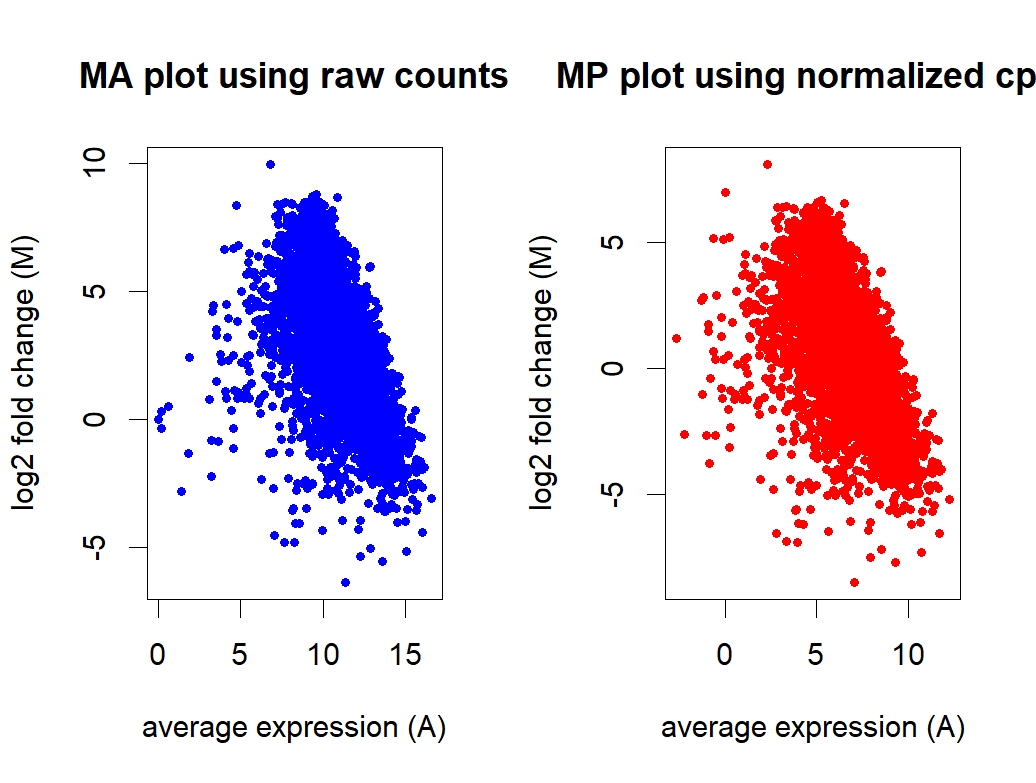
- MA plot before and after normalization
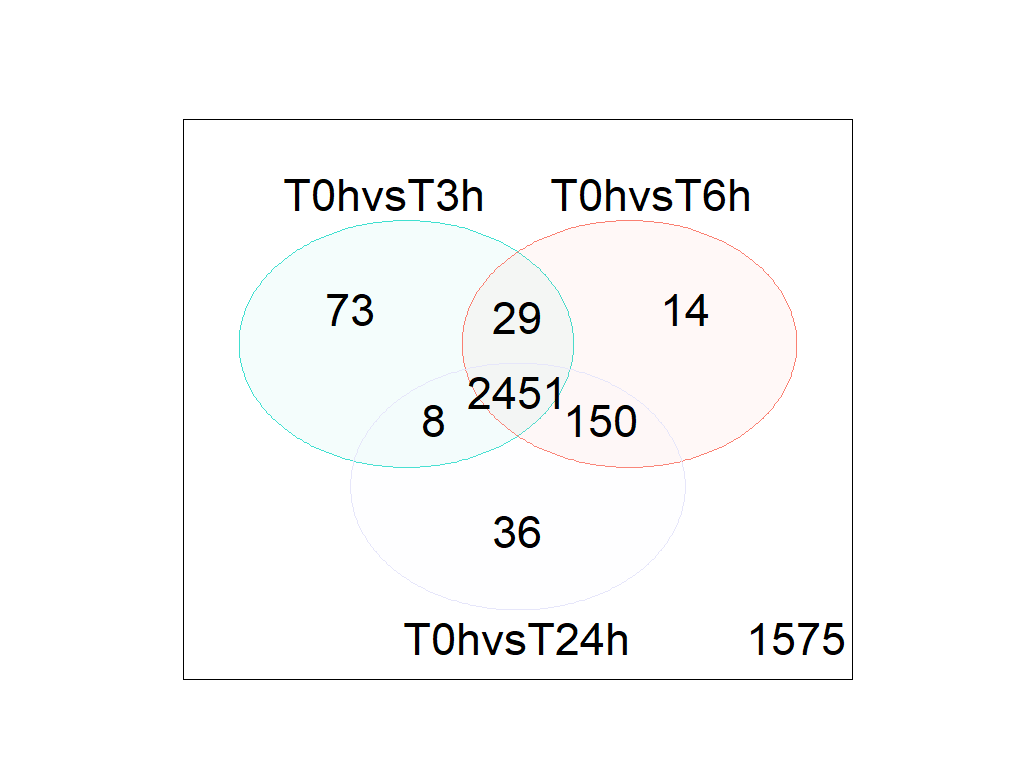
- Venn diagram shows a lots of DGE genes
reference:
- hicks et al 2018 Smooth quantile normalization
- Shao et al 2024 The impact of selective HDAC inhibitors on the transcriptome of early mouse embryos
Regards, Xuan


Thank you Michael for the insight! It makes sense to use stable genes as control for normalization. There are some "housekeeping genes" in E.coli but we don't know if they are truly stable in the two conditions we are comparing. If we just use these housekeeping genes, would it be better to use all of them as controlGenes or just a selective few based on their positions on the MA plot?
There is no general answer to this. The term "housekeeping" gene is not really defined in my opinion. Especially, it is something that generally refers to homeostasis, so their expression might or might not be altered in such a harsh treatment. What I personally do when I need control genes is to subset to the 10% of genes with highest baseMean per condition (that is the averave of the normalized counts per gene and group) and then intersect these between all groups. Then check where these genes are on the MA-plot. It might guide you to find some sort of baseline.
Agree with ATpoint
Because sequencing is about sampling relative abundance, this choice of how to analyze the data when there are lots of unknowns come down to the analyst and the people who know the system best. Statistical methods can only do so much when global shifts are present.