Hello,
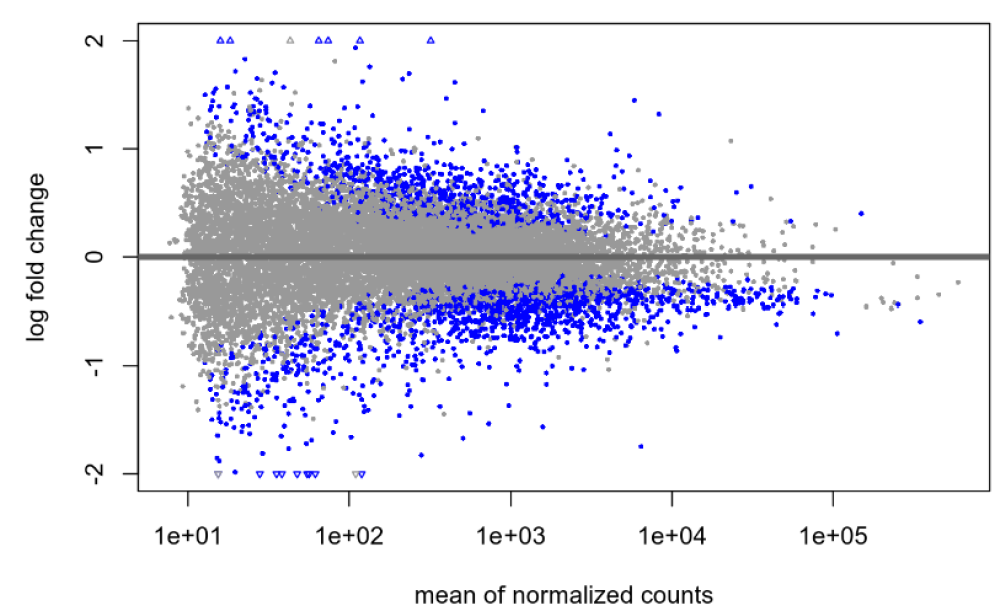
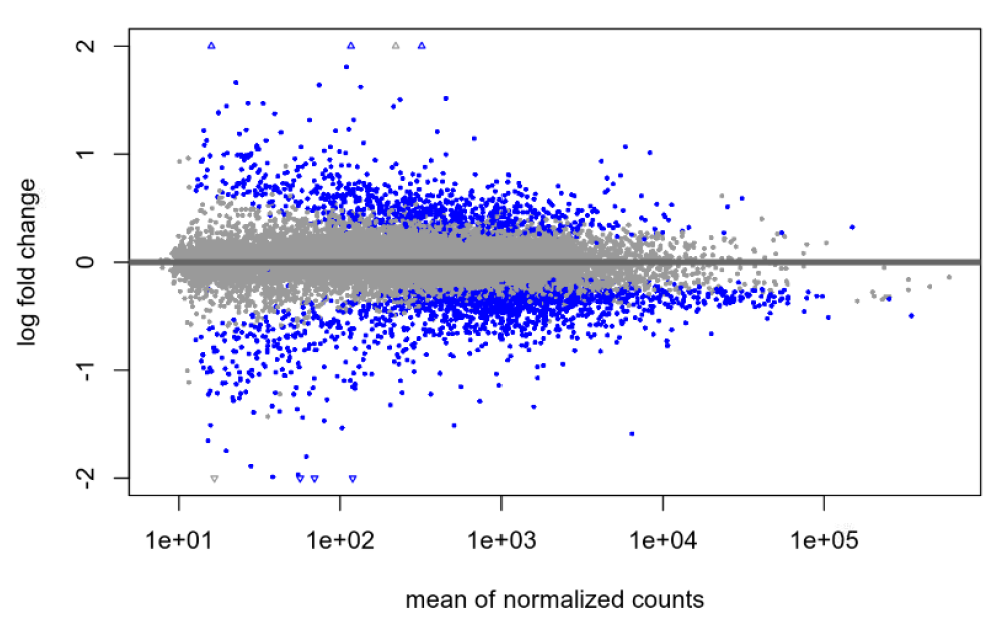
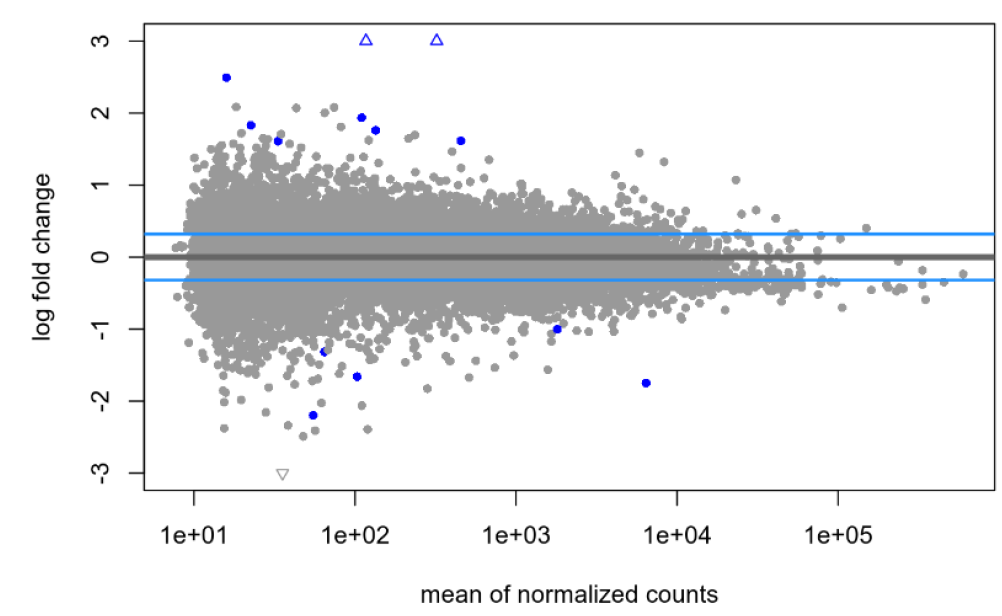
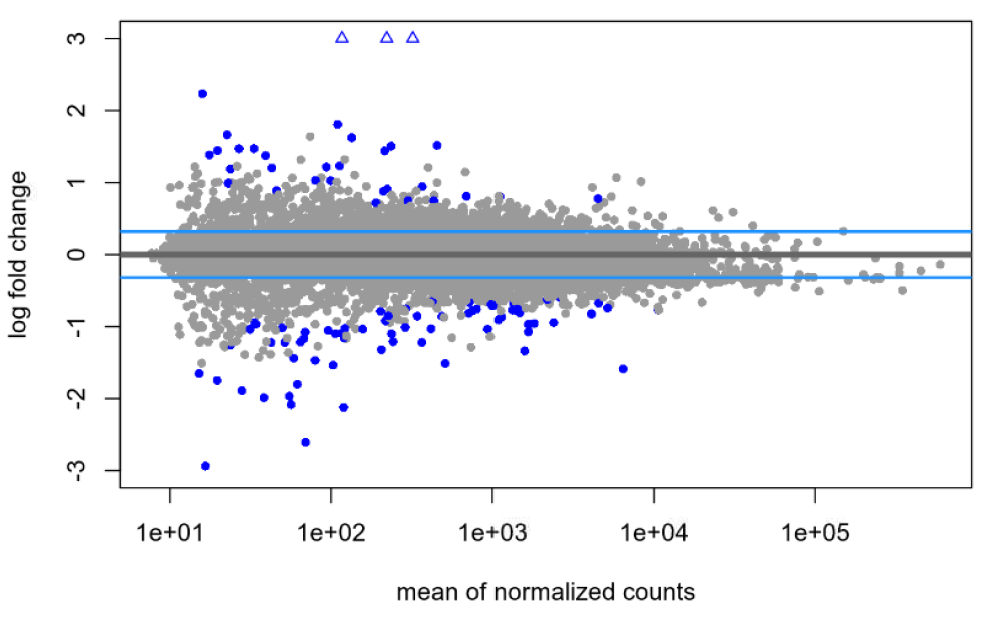
I am pretty new to DEseq2 and am hoping someone can help me shed light on an issue. I've been experimenting with shrinkage with apeglm on a publicly available dataset and am finding what I think is maybe unusual? With the default null hypothesis, lfcThreshold=0, I am finding the same large(ish) number of genes before and after shrinkage: 2268 genes at an alpha of 0.05. When I then try to apply a very liberal lfcThreshold of 0.322, I see a total 13 genes without shrinkage (at the same alpha of 0.05) and 103 genes following shrinkage (s-value cutoff of 0.005). My understanding was that the shrinkage was supposed to be more conservative, so why might I be seeing the opposite in my data?
Is it the quality of the dataset or something else? Is it possible that, if a non-zero LFC threshold is used, the shrinkage towards this threshold pushes more genes over the significance threshold, especially for genes with LFC estimates close to the threshold? Any advice on how to proceed or what else to look at would be welcome!
I'm including the relevant figures below:
Default null, no shrinkage:
Default null, after shrinkage:
lfcTheshold=0.322, no shrinkage:
lfcTheshold=0.322, with shrinkage:
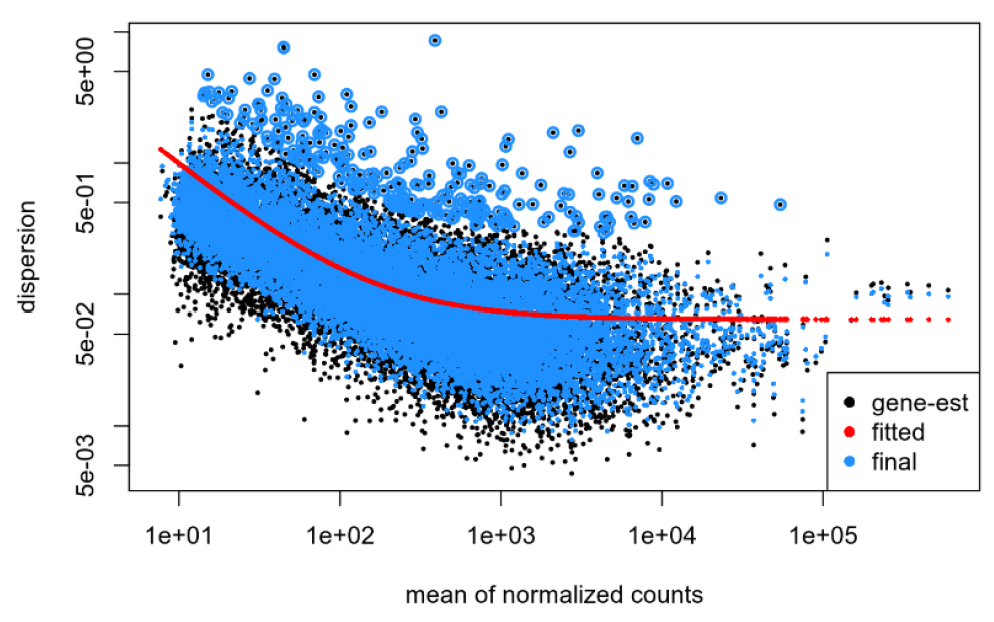
Dispersion plot for my data:
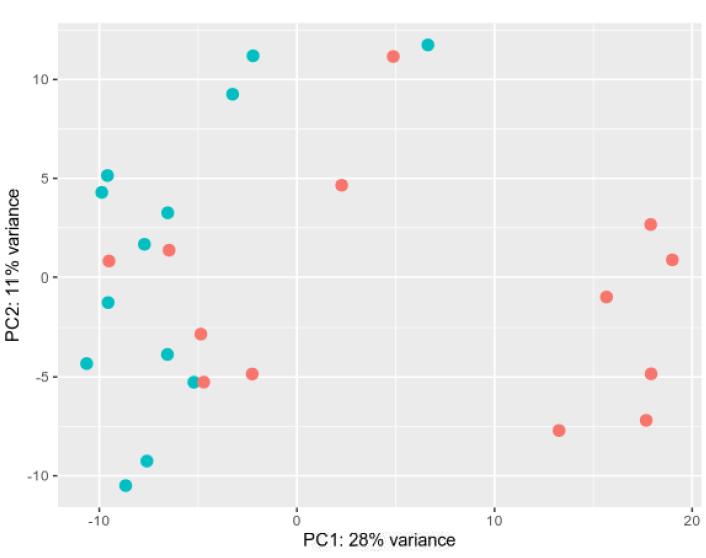
PCA plot: Not ideal, but I have already (to the best of my knowledge) removed the more problematic samples using various quality control methods.
The relevant code used to generate the four cases of results is below:
dds <- DESeq(dds)
res05 <- results(dds, alpha=0.05, name="treatment_vs_Control")
resLFC <- lfcShrink(dds, res = res05, coef="treatment_vs_Control", type="apeglm")
res05_withT <- results(dds, alpha=0.05, lfcThreshold = 0.322, altHypothesis = "greaterAbs")
resApeT <- lfcShrink(dds, coef="treatment_vs_Control", type="apeglm", lfcThreshold=0.322)


Hello and thank you for taking the time to answer my question! That's a good point, re threshold vs shrinkage. I know under regular conditions of an LFC threshold of zero, shrinkage is to correct the LFCs and does not change the p_adjusted values nor the number of significant DEs, but it can change the number of genes below a specific threshold (as defined post-factum) but shrinking down. However, I do not want to apply a threshold post-factum, but rather pre-emptively. What I am having trouble with is understanding how shrinkage works in the context of a pre-supplied LFC threshold, wherein the p-values end up being replaced by s-values and the statistical significance ends up being interpreted through an s-value cutoff (wherein 0.001 in s-value is supposed to be similar to 0.05 in p_adjusted). In this case, I appear to be getting a very different number of DEs? And the number increases for the shrinkage approach. I would appreciate any further clarification on this!