I am performing an analysis to look at the impact of 3 types of stimulation on 6 stem cell lines (each derived from 1 individual) and I ran the following code:
exprdata<-read.csv("Replicates Merged.csv", row.names=1)
metadata<-read.csv("Metadata.csv",row.names=1)
metadata$ID<-as.factor(metadata$ID)
precursors<-read.csv("Counts.csv",row.names=1)

form <- ~ 0 + Stim + (1 | ID)

compare <- makeContrastsDream(form, metadata, contrasts = c(compare3_1 = "StimFib - StimCon", compare3_2 = "StimFib - StimPDL", compare2_1 = "StimPDL - StimCon"))

fit <- dream(exprdata, form, metadata, compare, ddf = "Kenward-Roger")
fit2 <- variancePartition::eBayes(fit, robust=T, trend=log(precursors$Counts))

FibxCon<-variancePartition::topTable(fit, coef = "compare3_1", number=3469)
FibxPDL<-variancePartition::topTable(fit, coef = "compare3_2", number=3469)
PDLxCon<-variancePartition::topTable(fit, coef = "compare2_1", number=3469)
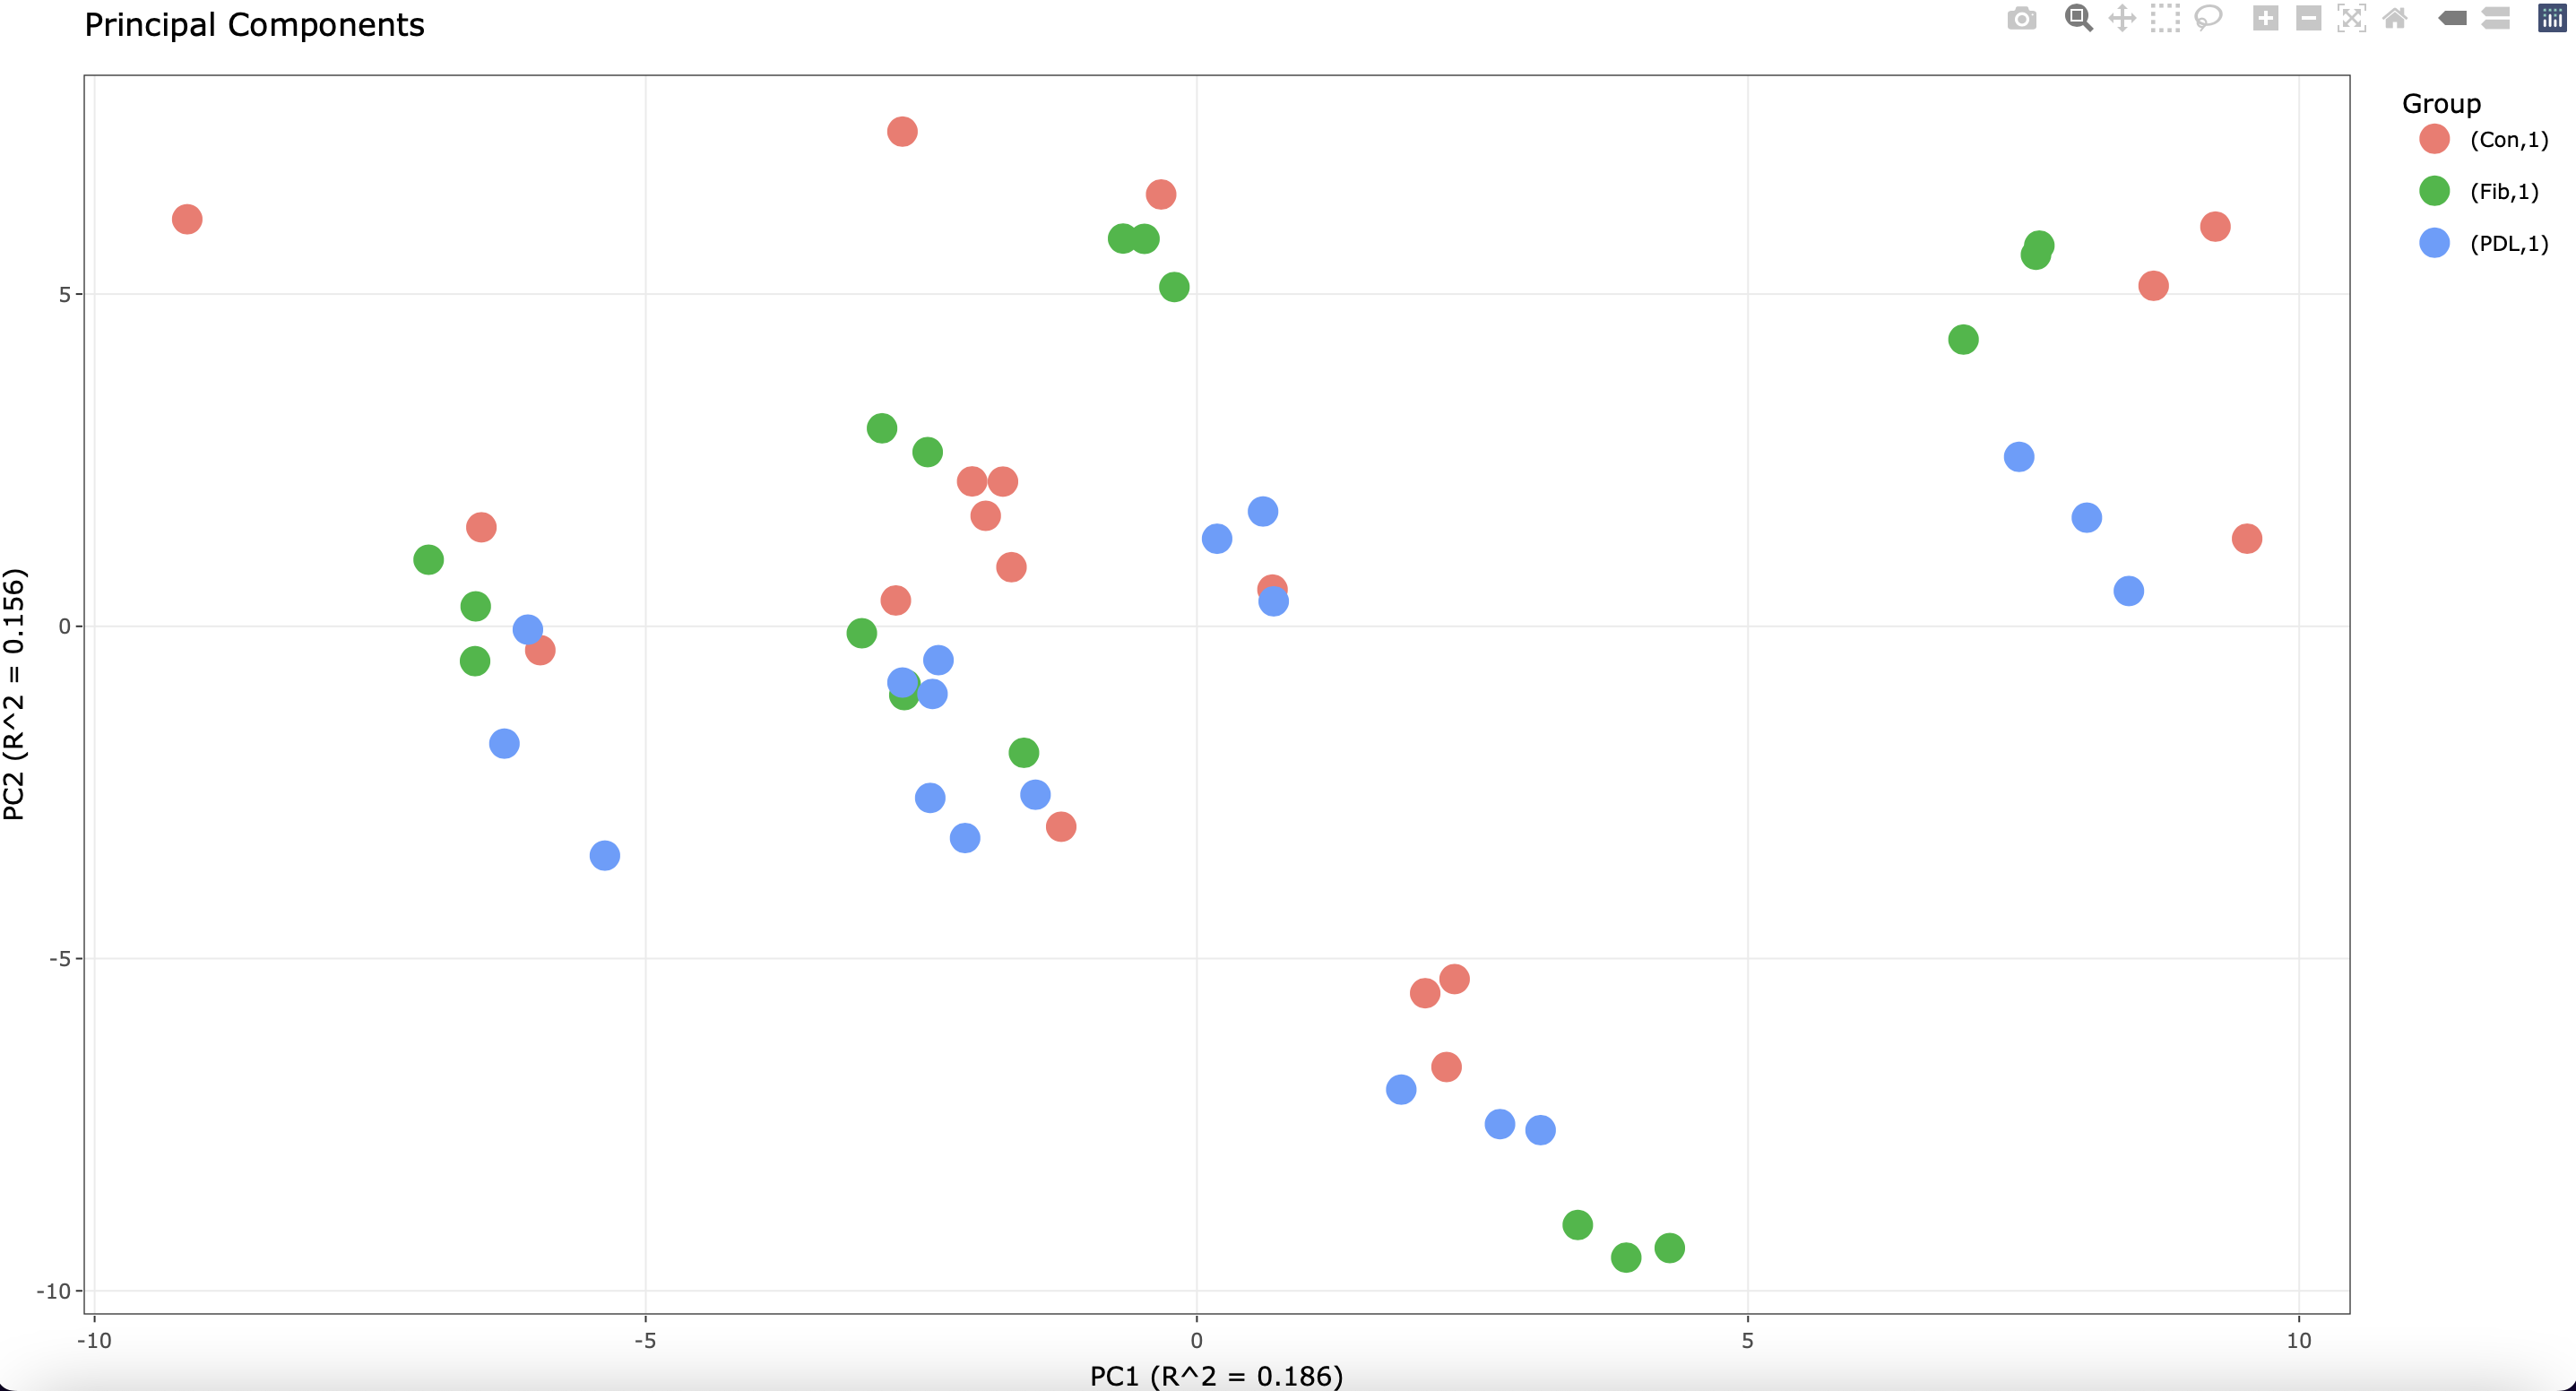
Of note, each cell line was plated in triplicate before stimulation. I see the following when running a PCA plot:
The most variation is attributed to the different cell lines. However, some of the technical replicates do not cluster well.
I thought it was best to merge the triplicates via median before running the model above. However, I started to wonder whether it be better to keep the triplicates separate? If so, would I have to change the structure of my random effect (ie nested)?
Any insights would be much appreciated!


gabriel.hoffman any insight?
It is almost always better to retain the full observed data, if the statistical software is able to model the repeated measures. This is a good application for a mixed model.
With count data, it is not clear how to collapse technical replicates, while allowing the statistical model to model count-error, varying library size and overdispersion.
1) In cases where there are multiple sources of expression variation, the variation partitioning plot can give insight not found in the PCA plot.
2) its not clear if you are using a voom-step here.
dream()is designed to take the result ofvoom()orvoomWithDreamWeights()3) Fitting
eBayes()with a trend is not recommended. Instead, incorporating precision weights from a voom-step intodream()is the best way to handle counts.4) It looks like you have biological expression variation due to
DonorandStimulusThanks, gabriel.hoffman
The data is actually proteomics so it is intensity data which is why I did not use voom but rather ran ebayes with a trend which included the log of the peptide counts corresponding to the intensity measures. I went this route as it was previously suggested by Gordon Smyth with limma https://www.biostars.org/p/9509937/.
Given the data is proteomics rather than RNAseq and my goal is to understand the impact of stimulus, would it still be advisable to not collapse the technical replicates or would using the median of technical replicates and still use dream with a random effect of cell line ID be appropriate? I was just concerned that not collapsing technical replicates would overinflate p values? Thanks for you help and advice!
For your proteomics data, your normalization is correct. I had assumed it was RNA-seq because that is what I think about most. When using only a fixed effect model, collapsing replicates protects against false positives. The advantage of the mixed model is that modeling donor as a random effect allows you to model the observed data directly without collapsing while still controlling the false positive rate
Thanks, gabriel.hoffman
My understanding is that both options would still be mixed models:
Even with technical replicates (3 wells per donor per stim) collapsed, I would still have paired measurements from each donor (ie each stim conditions) that I would use a random effect of donor to model.
When I tried running both options above (with and without collapsing with donor ID as a random effect) all I saw was smaller p-values but a similar protein list.
Therefore, I think I am just confused as to whether I would need a more complex random effect design if I do not collapse technical replicates. Would the data be considered nested (ie multiple wells within each of the different stim conditions)? I just want to make sure I do not misspecify the model.
Thanks for your help!