Hi all,
Thanks all for reading. I have a question related to measuring the correlation between gene clusters after performing clustering analysis.
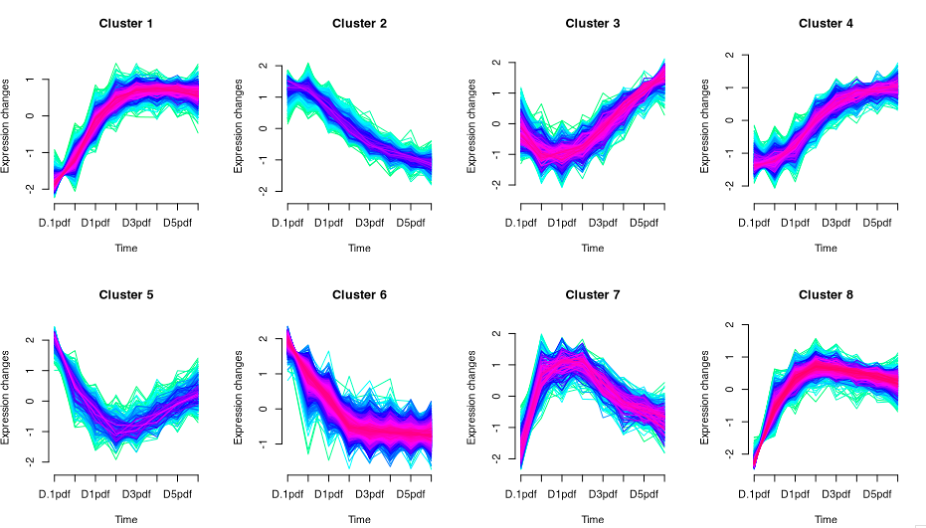
Long story short, I have perform soft-clustering (m-fuzzy clustering) to my time-series RNAseq data as below with 8 optimised clusters and the biological significance of each clusters makes sense based on the GSEA results. Now what I am interested in is the cluster 8 with the curve slightly going down after an exponential increment, which I would hypothesise that something must be correlated with clusters 3,4,5 going up in the corresponding timepoints.
My idea is simply perform a correlation test on the expression of these clusters to see which pairwise scores highest. I would like to ask if you could suggest any available R packages or any stat method to compute this. I am new in bioinformatics and was not able to find a close answer for my problem.
Thanks in advance and looking forward for any suggestion.
Code should be placed in three backticks as shown below
# include your problematic code here with any corresponding output
# please also include the results of running the following in an R session

sessionInfo( )


