Entering edit mode

Hello,
I'm trying to run DiffBind on my CUT&RUN data to get the differentially bound peaks between two conditions (DMSO and inhibitor). In sample_sheet.csv I only have the four samples I want to compare, two replicates each, and I'm running the following analysis:
samples_file=read.csv("sample_sheet.csv", header=T)
Diff_dba=dba(sampleSheet=samples_file)
Diff_dba_counts=dba.count(Diff_dba, minOverlap = 2)
Diff_dba_contrast <- dba.contrast(Diff_dba_counts, categories = DBA_TREATMENT, minMembers = 2)
Diff_dba_analyze <- dba.analyze(Diff_dba_contrast)
Diff_dba_report <- dba.report(Diff_dba_analyze, file="Diffbind_results", bNormalized = TRUE, th = 1)
However, when I run it, the output table looks like this:
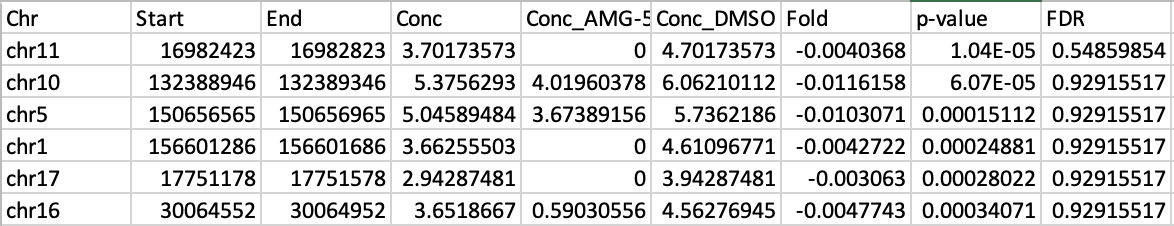
The Conc values look reasonable, but then the Fold values are completelly off, near 0, which would mean a near 1 Fold change, which is clearly not what the Conc values suggest. I really don't know what the issue is here, and I would appreciate any suggestions as to what I'm doing wrong/missing. Thank you in advance!
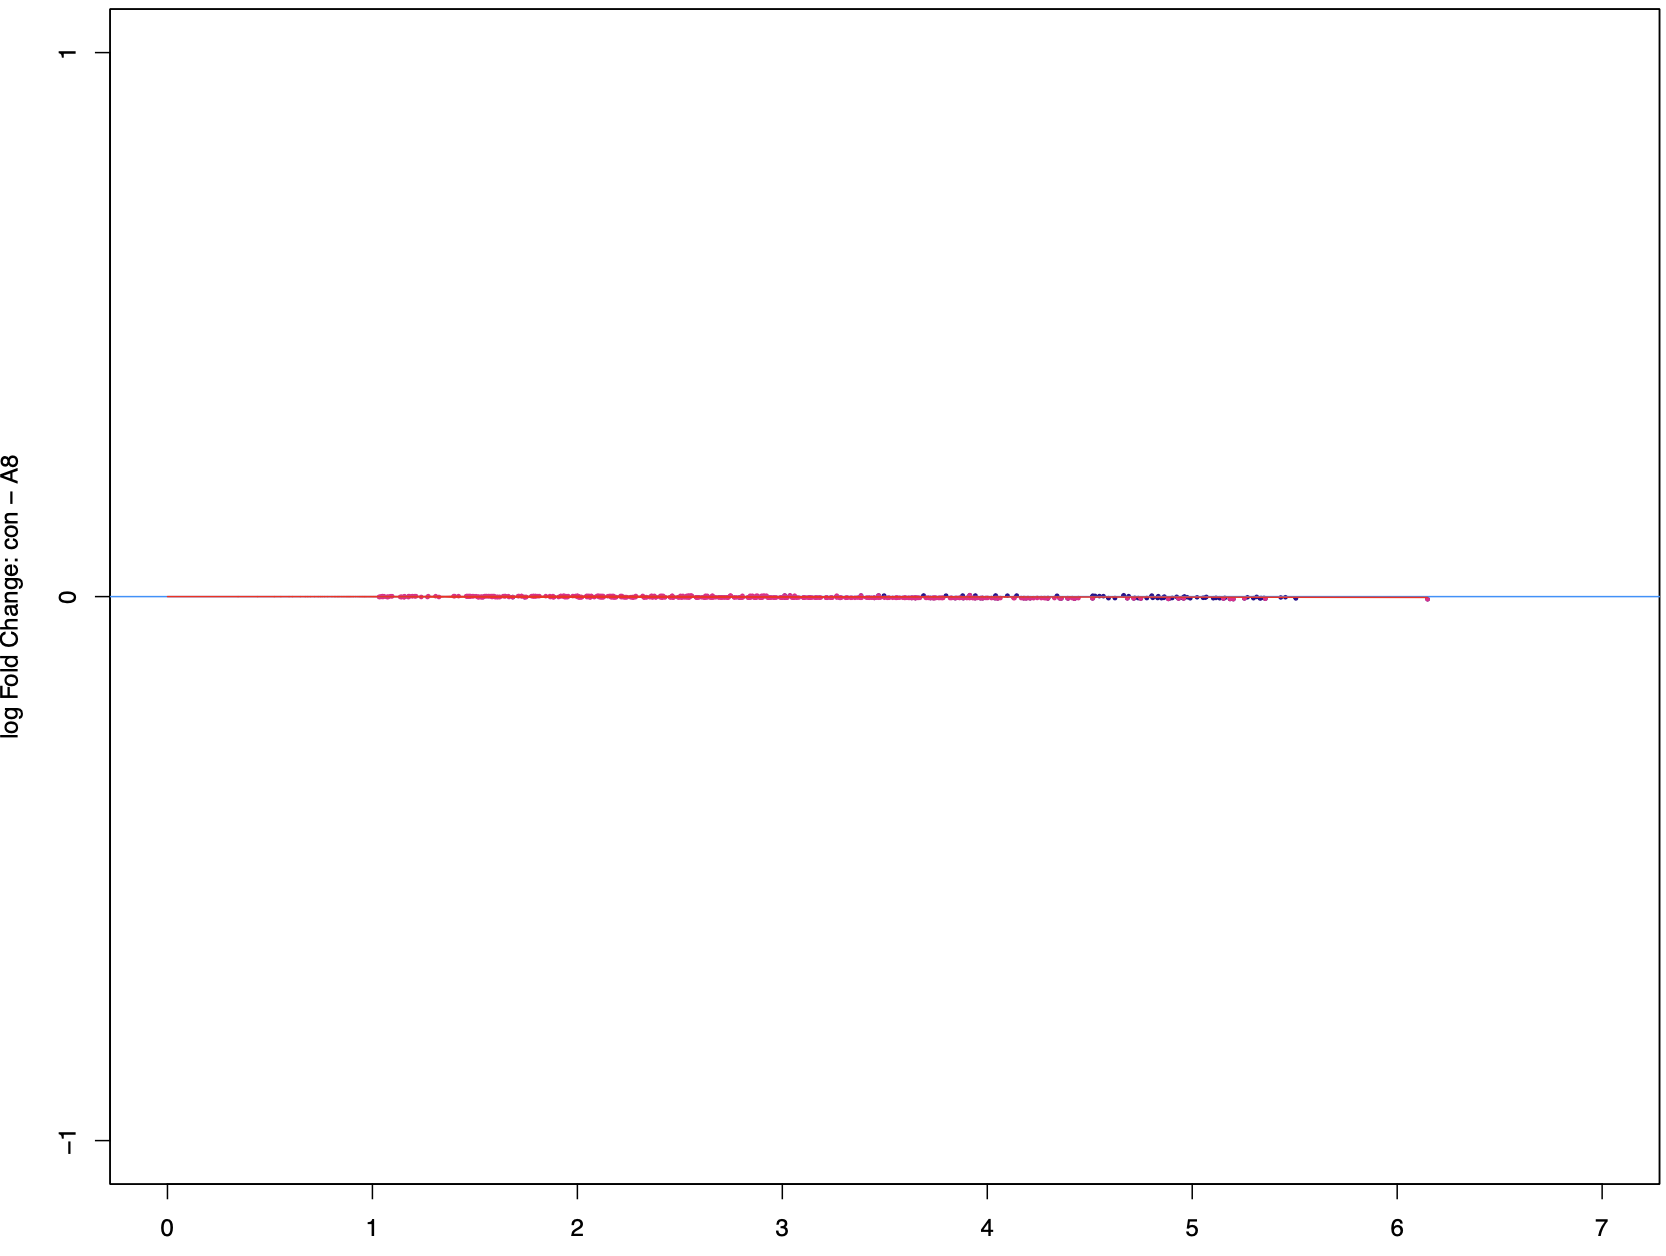
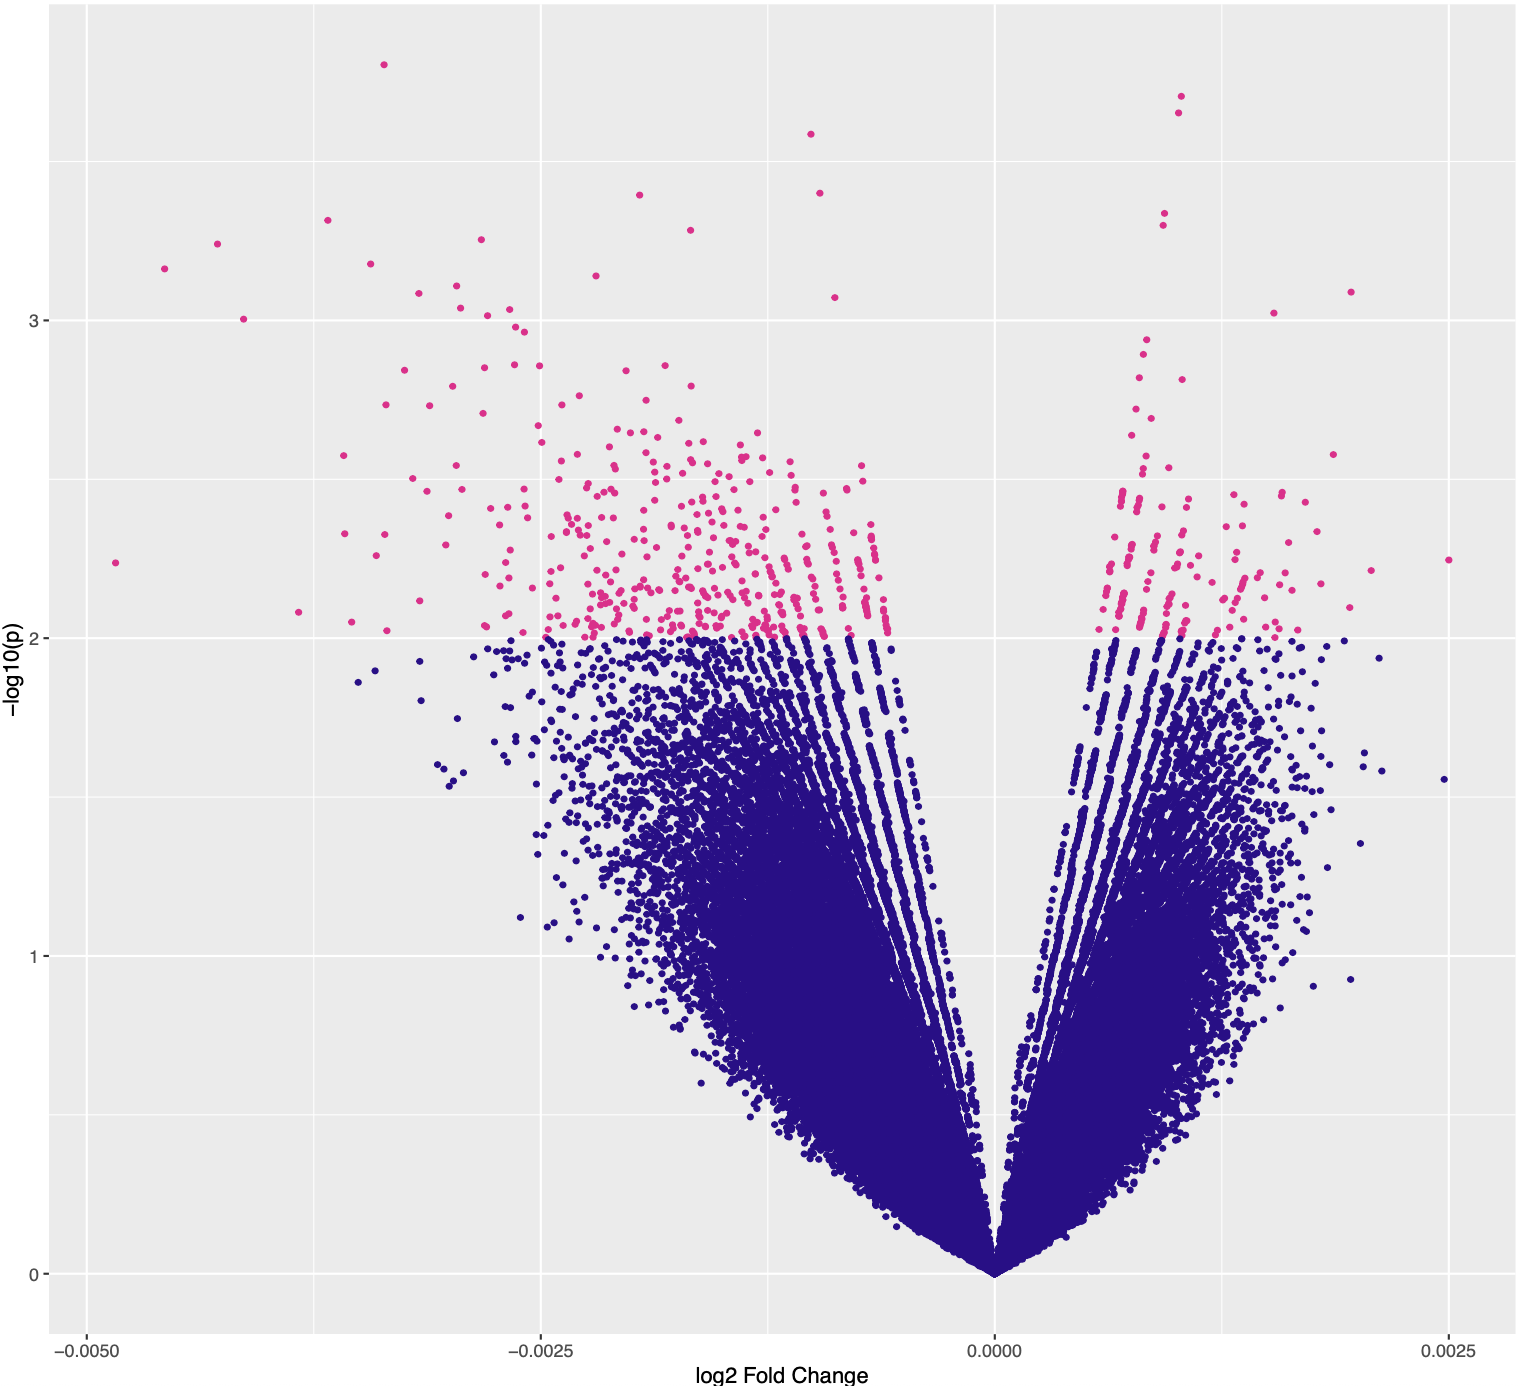
Almost certainly data are noisy and DESeq2 (which is used internally) shrinks the fold changes towards zero, because the naive fold changes (Conc_AMG vs Conc_DMSO) have no evidence to be reliable given the sample size and noise in the data. Do PCA and MAplots to explore how the data cluster and look.
Same issues. All peaks return to a fold near 0, although they are significant when visualizing in IGV. Please find the MAplot and volcanoPlot below. Is there any way to optimize the normalization or others? Thanks!