gene Set with high AUC score but no cells assigned to cell type
1
0
Entering edit mode
gogeni5529 • 0
@f0c6be99
Last seen 24 days ago
Germany

I'm trying to understand the results of the AUCell run.

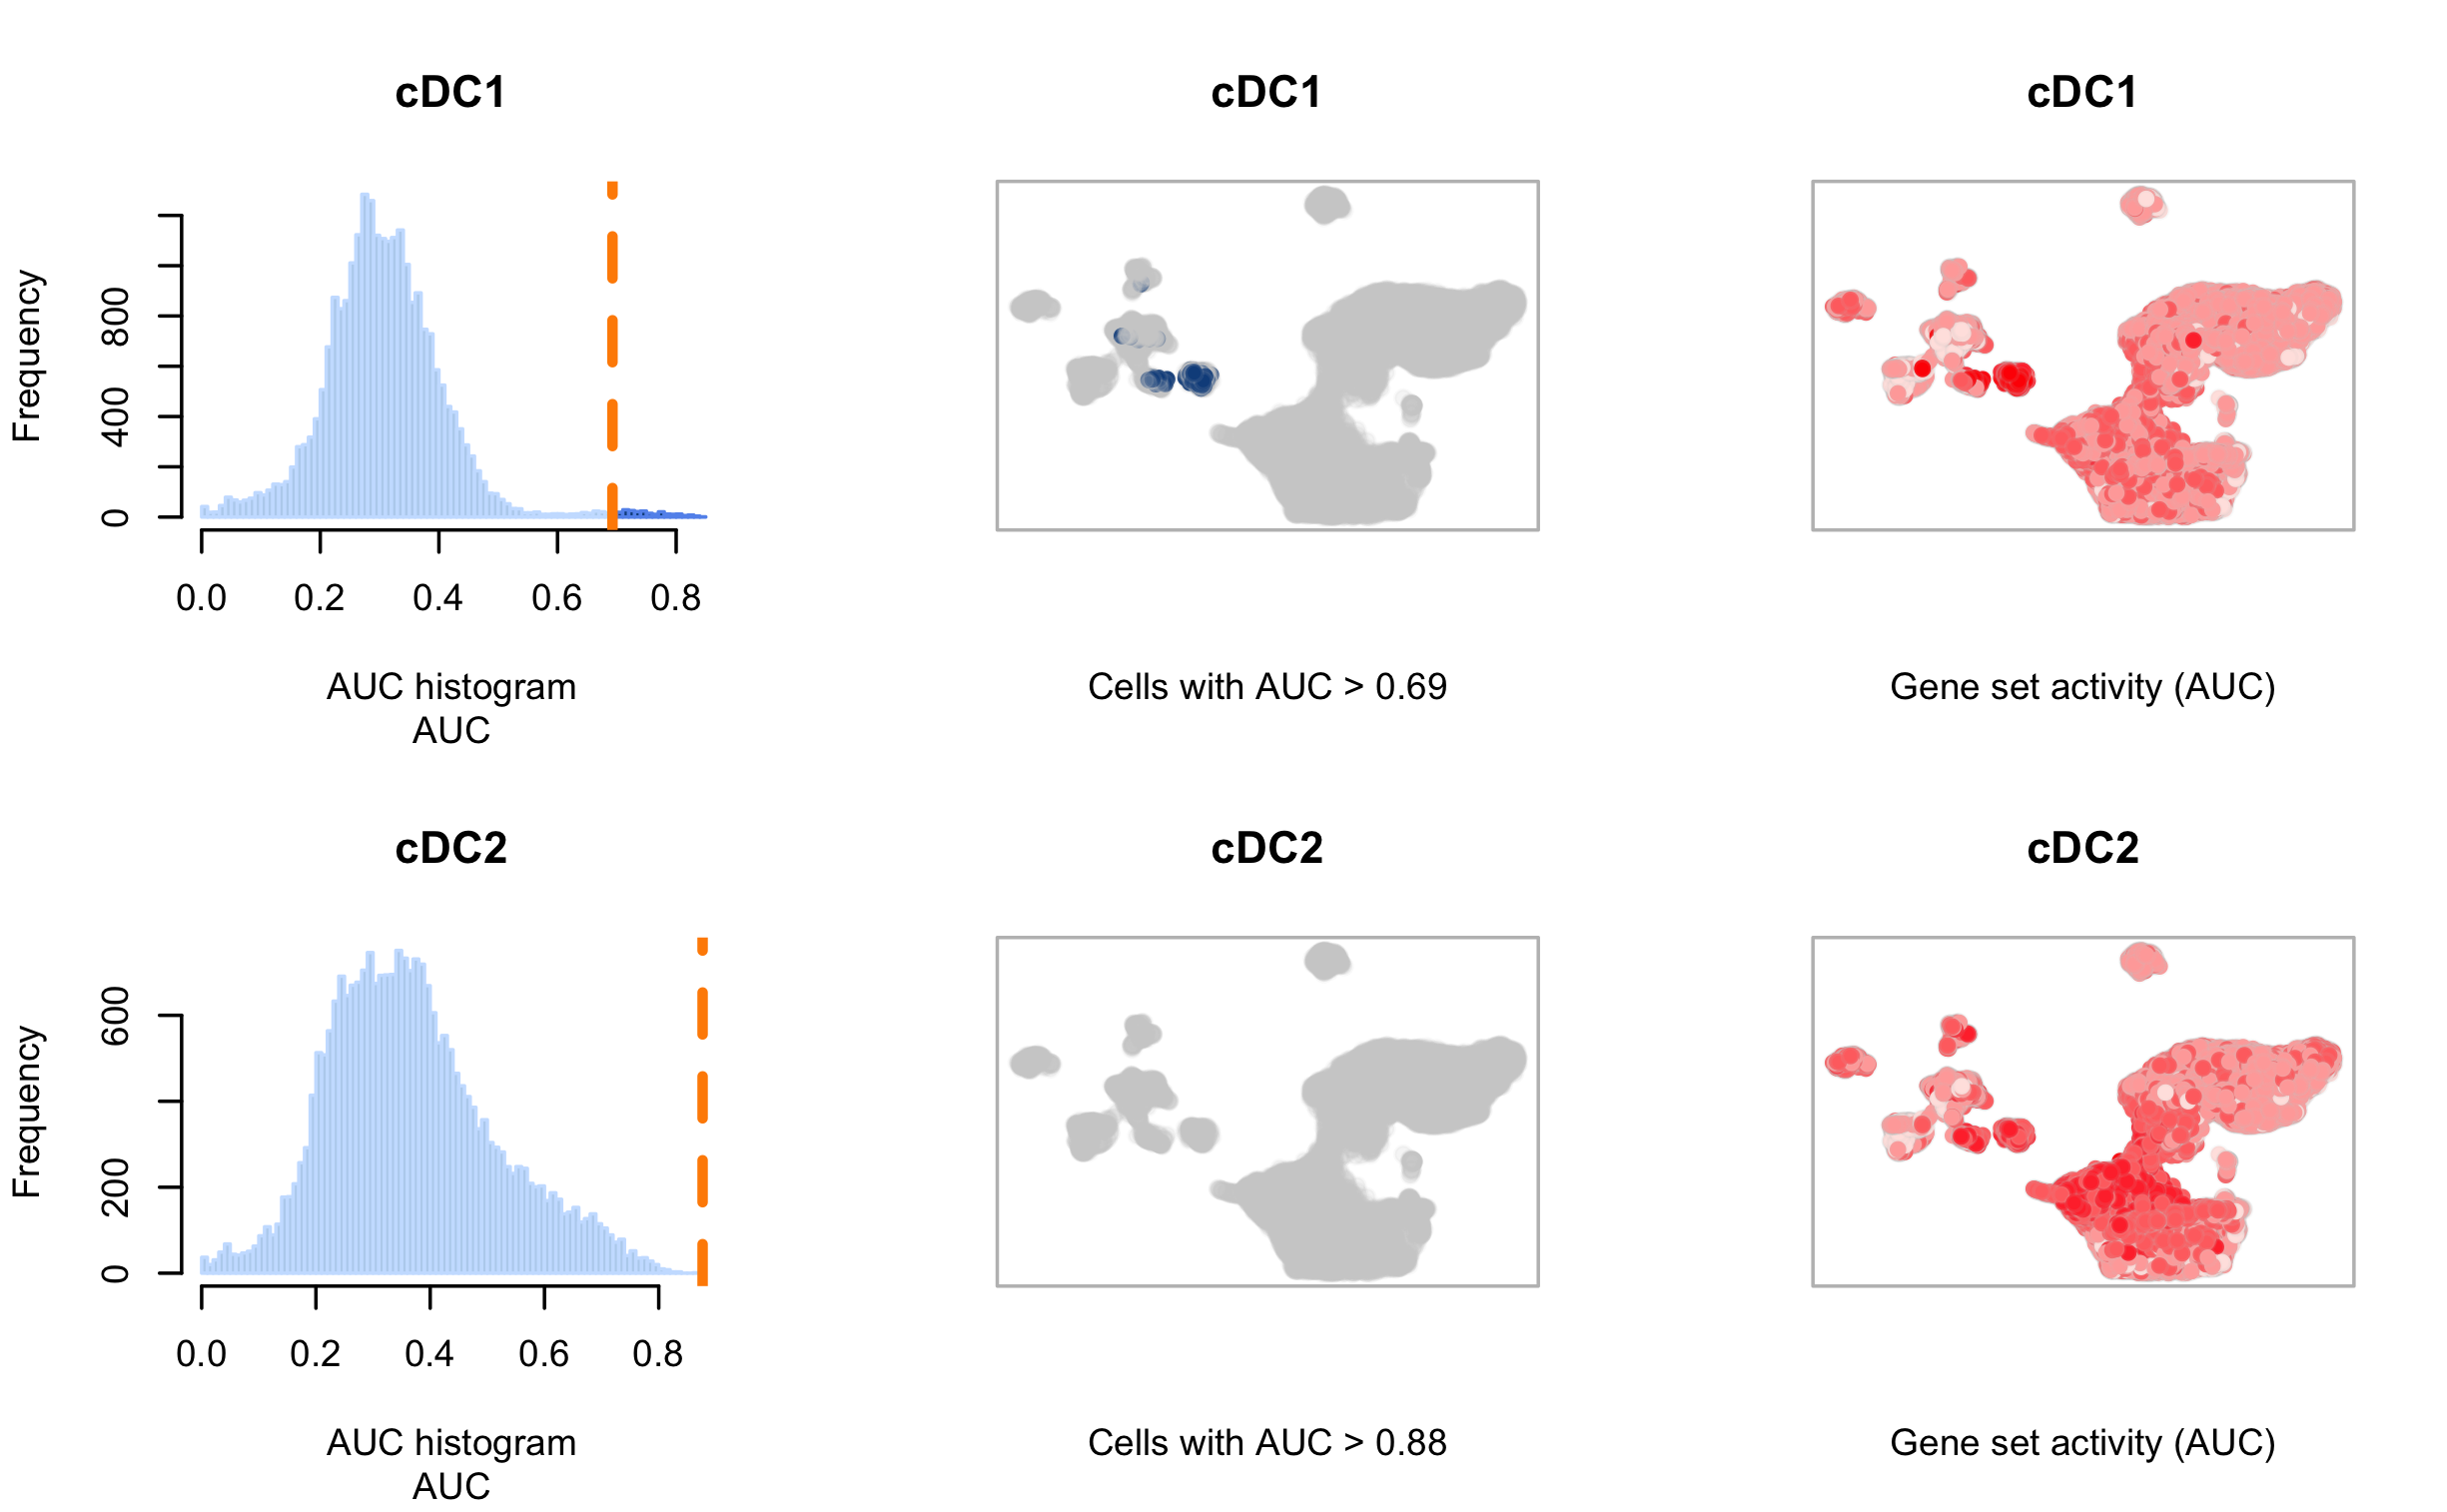
I tested my single-cell data set with specific DC cell-types gene sets. The image below shows two fo the gene sets. for cDC2 i have a very high AUC score, but for some reason no cells are assigned to this category.

If I understand the way the AUC scores are calculated, a high AUC means, many of the genes in the cDC2 gene-set are expressed in the cells, but in the middle plot (created with AUCell_plotTSNE) none of the cells are assigned to this category.

From what I've read, the reason might be connected to the histogram to the left. As I don't have the expected bi-modal behavior, AUCell has difficulties setting a "better" threshold and prefers a somewhat more conservative value. As there are no cells higher of this value, I get an empty UMAP scoring.

On the UMAP to the right though I can see cells with activity in this category. But these cells are not really localized as a cluster, but more spread over multiple regions.

My question is therefore, can I trust AUCell with this value, or do I need to manually assign a lower AUC score to this cell-type. How would I choose a "better" score?

thanks

enter image description here

AUCell • 212 views
ADD COMMENT
0
Entering edit mode
Kevin Blighe ★ 4.0k
@kevin
Last seen 1 hour ago
The Cave, 181 Longwood Avenue, Boston, …

Hi,

You have correctly identified the issue: AUCell's automatic threshold selection is conservative by design, aiming for specificity to minimise false positives, especially when the AUC distribution lacks a clear bimodal shape. This can result in no cells being assigned despite high overall AUC values, as the threshold is set at a density minimum that few (or no) cells exceed.

You can trust the automatic results as a starting point, but for your spread-out cDC2-like cells, a manual adjustment to a lower threshold will likely improve sensitivity without much loss of specificity - inspect the histogram to choose one that captures the visible activity on your UMAP (e.g., around the elbow or 75th percentile of AUC values).

Here is simple code to extract AUCs, set a custom threshold (try values like 0.1-0.2 based on your plot), and re-visualise:

# Assuming 'cells_AUC' is your AUCell output and 'geneSetName' is "cDC2"
auc_values <- getAUC(cells_AUC)[geneSetName, ]
custom_thr <- 0.15  # Adjust based on histogram; plot to check

# Assign cells above threshold
assigned_cells <- names(which(auc_values > custom_thr))
length(assigned_cells)  # Check how many

# Plot UMAP with custom threshold (replace with your tsne/umap coords)
AUCell_plotTSNE(tsne_coords, cells_AUC[geneSetName, ], 
                aucThreshold = custom_thr, colBy = "AUCell")

This should highlight those spread cells properly. If the gene set is too broad, consider refining it to core markers for tighter clustering.

Kevin

ADD COMMENT

Login before adding your answer.

Traffic: 876 users visited in the last hour
Help About
FAQ
Access RSS
API
Stats

Use of this site constitutes acceptance of our User Agreement and Privacy Policy.

Powered by the version 2.3.6