
Hello everyone!
I'm doing WGCNA co-expression analysis on 29 samples related to a specific disease, with RNA-seq data with 100million reads. After all quality control, I ended up with 53000 genes in FPM measure. I then filtered all genes with 0 variance, miRNA and pseudogenes, also genes that had less than 10 reads across more than 90% of samples. I ended up with 14000 genes.
When I run goodSamplesGenes, everything seems ok.
I run power treshold and ended up choosing 7 (graphs attatched)
 Then I run WGCNA blockWiseModules(), with block size 5000 (tried 7000 and 8000 with no good results). I will do an analysis with the full data with our HPC.
But I got one big turquoise module, which is very unexpected.
 If I change the network to "signed hybrid", I start getting a little bit more clusters:

Any ideas?

Indeed, using all genes at once changed it a bit, but not too much as the turquoise block is still big. It is very strange to find a big cluster which is not expected for the disease I'm studying, but might be very helpful also! One thing is that I'm working with one tissue, so maybe the turquoise genes are correlated because of this (biological effect).
When doing cluster analysis, I get 2 to 3 clusters, but by using cluster validation they seem robust. I will do consensus analysis with my clinical data.
Do you have any advice on how to deal with categorical variables with more than 2 classes when doing eigen values correlation?
You seem to have ignored the first issue I raised. I do suggest making sure your data do not contain large spurious expression drivers.
Regarding categorical variables, you may want to read https://peterlangfelder.com/2018/11/25/working-with-categorical-variables/.
Any techniques to test for spurious expressions drivers? My PCA seemed good, with Dim 1 representing 66% of data variation and Dim 2 6%, which was good for how much data I used.I have tested VAT graphs on distance matrices and they seem pretty good also, indicating nice clustering. Also I'm starting consensus analysis and correlations to see if any GO term is biologically enriched (biological validation of correlations, also by using clValid package), but I'm having my time with categorical traits that are not ordinal and have more than one category (those that might need dummy coding), simply because I never worked with dummy variables and their interpretation. The same problem with categories applies to WGCNA, I think it would be nice if the package could use Gower Distances so categorical data is not so different from numeric data (at least in terms of analysis, not interpretation)
The first PC explains 66% of the variance? That's more than a module eigengene in the typical analyses that I do, which is usually in the 30-60% range. So obviously you have a major expression driver. What it is and whether it is spurious is difficult to say without a deep dive into what your data represent, how they were collected/generated, preprocessed etc. Some suggestions are laid out in WGCNA FAQ point 4 ("Can WGCNA be used to analyze RNA-Seq data?"). I would especially check the quantile scatterplots (calculate say the 30%, 50%, 70%, 80% and 90% quantile for each sample, so you get 5 vectors of 29 quantiles, the use pairs to plot them - if you see strong correlations, chances are you have a normalization problem).
After some reading, I've been trying some other normalization techniques. As per WGCNA basis, I've done log2(x+1), which radically changed my results (more clusters and power treshold got to over 0.9 within 7 power) and PCA dimension 1 lowered to 17 variance. Do you have any advices on scaling? Log2 vs Z-score
I am not sure what you mean by x. You mentioned above that you started with FPM; I suggested that you need to use some sort of normalization before anything else. Once the data are normalized, use log. The offset can be 1, although you could also try to choose an offset that makes the mean-variance relationship approximately constant.
Alternatively, you can start from the raw counts and apply varianceStabilizingTransformation in DESeq2. This includes both a normalization and a transformation step.
Hi Peter, I am working on WGCNA for DNA methylation EPIC array data. To do co-methylation module detection, I selected the top 400,000 CpG probes with high variance across 71 samples. But, I always get a big module which will lead to the cluster dendrogram looking so weird... So, do you think I have the same problem as avelarbio46?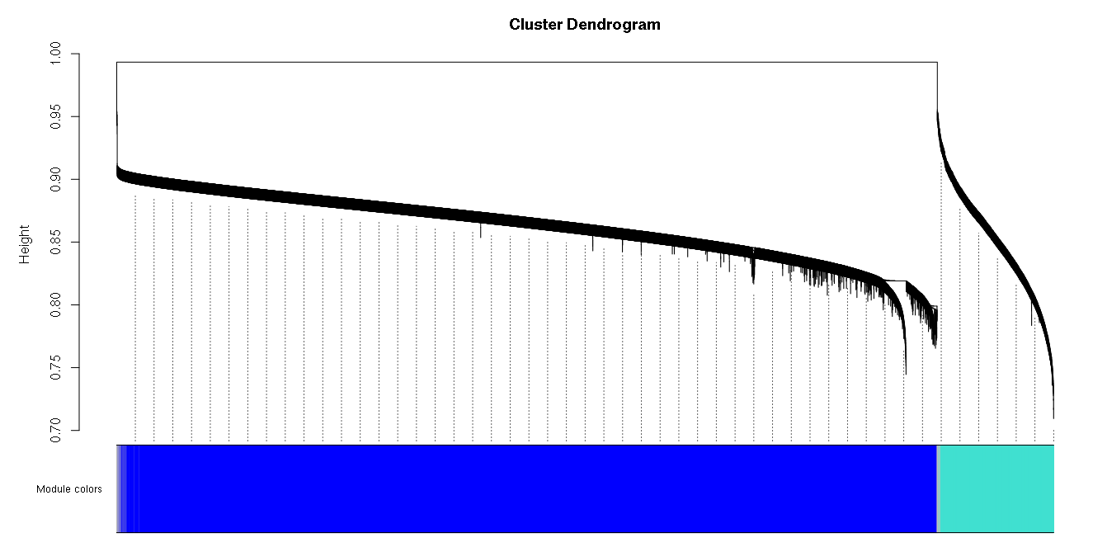 . Do you have any suggestions? Thanks.
Chances are you have used the blockwise funtionality of blockwiseModules. In that case, the dendrogram you see only refers to the first block. See WGCNA tutorial, section 2c - you need to loop over all blocks to plot the dendrograms in all blocks. Also, if you execute
table(bwLabels)(substitute the variable that holds the module labels), you should see more modules and their sizes.