DESeq2 normalization vs VST vs rlog
3
4
Entering edit mode
Jonas B. ▴ 40
@jonas-b-14652
Last seen 5.1 years ago
Belgium, Antwerp, University of Antwerp

Hi all,

after consulting the manual on data normalization, I have one question left to ask:

The way I see it, there are 4 ways described to obtain normalized data:

  • The first one is to extract data, normalized using the normalization factors for a gene x sample matrix, and size factors for a single number per sample. This can be done using the following code:

    counts(dds, normalized=TRUE)

  • The second way is to perform log2 transformation log2(n + 1), using the following function:

    normTransform(dds)

  • The third and fourth way is to use the vst and rlog transformation, using the following functions respectively: vst(dds, blind=FALSE) rlog(dds, blind=FALSE)

When I just got started, I used the the first function (counts(dds, normalized=TRUE)), to obtain the normalized data, which I later used for clustering etc. . However, now I doubt that this was the correct decision and that the normalized data, obtained this way, is only used during the DE genes analysis and that for clustering, the second, third and fourth way of normalization is preferred.

I was hoping that any of you could share a more expert opinion on the what normalization to use and whether or not the "counts(dds, normalized=TRUE)" is a viable option as well.

Thank you a lot in advance.

Kind regards, Jonas

deseq2 • 29k views
ADD COMMENT
0
Entering edit mode

As a side note: I did find a recent question addressing normalization ( https://support.bioconductor.org/p/123651/ ) , however it leaves my question unanswered on whether or not I could also use the counts function ( I guess it's wrong, but I am not sure. Maybe it is still usable... ) and which one is most commonly used/advised. Any opinions shared are much appreciated!

ADD REPLY
0
Entering edit mode

It came to mind that the function: counts(dds, normalized=TRUE), might already return log2 transformed data? (However, this is not described in: https://www.rdocumentation.org/packages/DESeq2/versions/1.12.3/topics/counts)

ADD REPLY
2
Entering edit mode
@mikelove
Last seen 1 day ago
United States

Take a look at the workflow (linked from the top of the vignette).

There we suggest to use transformations for anything involving a distance (also we say this in the DESeq2 paper). We give reasons for this suggestion and in the paper we evaluated alternatives.

My preferred transformation of the two we provide is VST, because it is fast.

ADD COMMENT
0
Entering edit mode

Dear Michael, thank you for your quick reply.

I've read the vignette and in the future I will definitely go for VST then.

About the normalized counts I've obtained using the function "counts(dds, normalized=TRUE)":

  • The normalized counts obtained here, are they also log2 transformed? I was unable to find this in the vignette, but a section on "Heatmap of the count matrix" does address this normalization, next to VST and rlog, and it seems to work fine. I am trying to assess what these normalized counts can be used for and whether my previous findings using these normalized count are still valid. (Ofcourse, I will repeat the normalization using VST in the long run.)
ADD REPLY
0
Entering edit mode

That’s not using counts() in the plot. Take a closer look at the code.

ADD REPLY
0
Entering edit mode

Indeed, I am sorry, it is used in code where 20 genes get preselected, on which later on the normTransform function (log2(n+1)) was performed. I should have looked more carefully.

Do you mind still sharing the answer to my previous question concerning the function "counts(dds, normalized=TRUE)"?

  • The normalized counts obtained here, are they also log2 transformed?

  • Is the normalization only used for differential expression analysis or could it also have value for clustering later on (even though it is not recommended by the vignette - I'm asking this because I want to assess the value of my previous analyses)?

Thank you in advance for your time.

ADD REPLY
0
Entering edit mode

I think it’s pretty clear from documentation that this gives counts divided by size factors. So, no, it is not log2 transforming and there is in fact a separate function for producing log2 transformed counts...

I do not recommend clustering untransformed data. There was a recent post about this on the support site, but again the reasons are in the documentation and also in the publication.

ADD REPLY
0
Entering edit mode

Dear Micheal, Thank you for your time and answers. It's all clear now. Kind regards, Jonas

ADD REPLY
2
Entering edit mode
@shangguandong1996-21805
Last seen 2.1 years ago
China

In my opinion, the main role of normalization factors(or your first one) is for DE. you have to normized your count to deal with some sequence factor or biology factor before your do DE analysis. For the practical ways, you can extract norm count and show these to your collaborator, or you can plot single gene expression tendcy. But you can not just use these normalized counts to do some operation like Heatmap plot, Hierarchical clustering, k-means because of different orders of magnitude.

For the vst or rlog, the main role has been writen in the DESeq2 paper:

The results, shown in Additional file 1: Figure S17, revealed that when the size factors were equal for all samples, the Poisson distance and the Euclidean distance of rlog-transformed or VST counts outperformed other methods. However, when the size factors were not equal across samples, the rlog approach generally outperformed the other methods. Finally, we note that the rlog transformation provides normalized data, which can be used for a variety of applications, of which distance calculation is one.

When you do some operation based on distance calculation(maybe some machine learning application?), you can choose vst or rlog, even log(normCount + 1). For the practical ways, you can plot single gene expression tendcy. But I do not recommend it, because it have less biology meaning compared with normCount. And for PCA, clustering, or kmeans, it is more suitable compared with normCount.

But I also have a question. someone may use Z-scale of normCount to do kmeans or Heatmap plot. I am wodering what's the pros and cons of z-scale of normCount and vst or rlog ?

ADD COMMENT
1
Entering edit mode

Z scaled normalized counts are not variance stabilized with respect to the systematic trend, it’s just forcing all the SD to 1, whether the variance across samples is predominantly made up of shot noise or signal (DE). I don’t recommend unit scaling all genes without having first having removed low biological signal genes from the matrix under study.

ADD REPLY
0
Entering edit mode
guyho ▴ 20
@guyho-15677
Last seen 3.5 years ago
Israel

Hi,

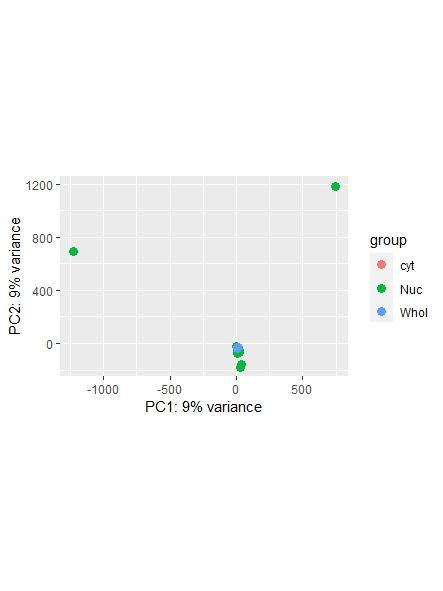
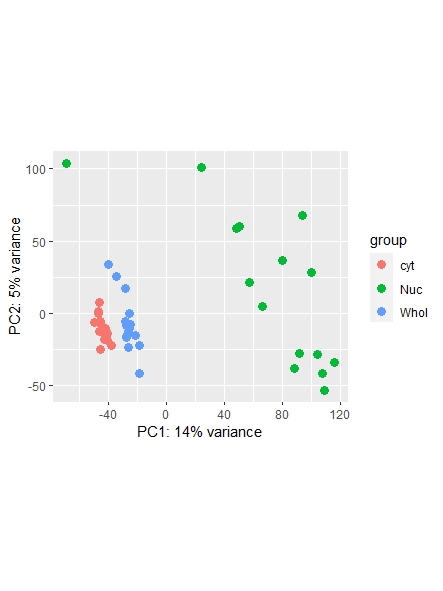
I hope it is fine to add my question here. I did rlog and VST followed by PCA. The experimental design has two factors each with 3 levels each, and there are 45 samples. With rlog the PCA clustered 43 samples together and 2 samples were outliers. With the VST the PCA plot corresponds to the experimental design. My questions are what can I learn from this result about the data? and can I use this information to improve the differential analysis? I upload the PCA images below.

Thanks in advance,

Guy

rlog PCA

vst PCA

ADD COMMENT
1
Entering edit mode

Note: you posted this as an “Answer” to the top Question not a comment.

I recommend the VST in general, depending on how you ran the code the rlog may be over shrinking the changes between groups.

ADD REPLY
0
Entering edit mode

Thank you very much for the prompt reply. I thought my question is related to this post. I can move it to be a comment on the original post if it is more appropriate.

I ran the default DESeq pipeline, then I did the transformations and PCAs with and without blinding (which did not affect the PCA results). Clearly the VST is better here, but does it make any difference to the differential analysis? for example, should I be concerned about the two samples that are outliers in the rlog?

ADD REPLY
1
Entering edit mode

No difference I think. I’m not convinced those are outliers. You can use plotCounts on DE genes for further inspection.

ADD REPLY

Login before adding your answer.

Traffic: 641 users visited in the last hour
Help About
FAQ
Access RSS
API
Stats

Use of this site constitutes acceptance of our User Agreement and Privacy Policy.

Powered by the version 2.3.6