How to create manhattan plot with DESeq2
2
0
Entering edit mode
adeler001 • 0
@adeler001-21743
Last seen 2.1 years ago
Canada

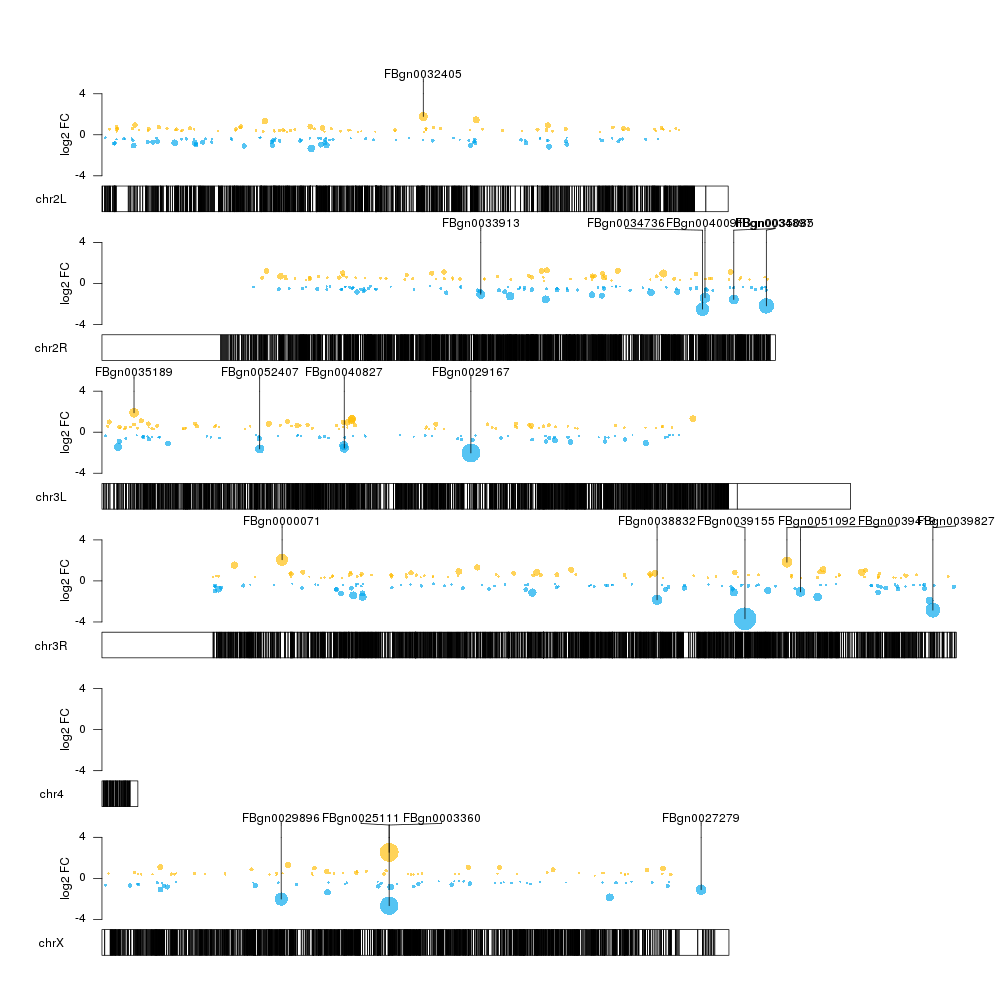
I used DESeq2 to do my Differential gene expression analysis for my RNA seq data. I would like to know what script I can use to generate a manhattan plot where I have the chromosome position on the x axis and p values on the y axis .

Thanks

deseq2 mahattan plot RNA Seq • 2.5k views
ADD COMMENT
0
Entering edit mode
@mikelove
Last seen 19 hours ago
United States

You can use this code (just modifying so the -log10 pvalue is plotted instead of the LFC). Also you'd probably not want to bother adding the genes because there will be too many.

https://bioconductor.org/packages/devel/workflows/vignettes/rnaseqGene/inst/doc/rnaseqGene.html#plotting-fold-changes-in-genomic-space

~~For more details see the Gviz vignette.~~

This works if you've used tximeta to import the gene expression data. If you've used another pipeline, you'd need to manually add the locations if you haven't already done so.

ADD COMMENT
0
Entering edit mode

hello Michael thanks for answering my question, I looked at the 1st link you gave , it doesn't have a section on manhattan plots

ADD REPLY
0
Entering edit mode

If you want specific help, can you provide more specific information about what you have?

How have you quantified gene expression? Are you using tximport/tximeta or some other counting tool?

Do you already have a DESeqDataSet with chromosome and start position for each gene, or do you need to know also how to obtain this information?

I have more specific recommendations after you've obtained the chromosome and start position:

You can use Sushi::plotManhattan as described here:

https://bioconductor.org/packages/release/bioc/vignettes/Sushi/inst/doc/Sushi.pdf

Or you can use ggbio::plotGrandLinear as described here:

http://bioconductor.org/packages/release/bioc/vignettes/ggbio/inst/doc/ggbio.pdf

ADD REPLY
0
Entering edit mode

Hello Michael . I did not use tximport/tximeta. I used featurecounts to get the read counts, I dont have the chromosome positions , how can i include that information ?

ADD REPLY
0
Entering edit mode

Take a look at the Rsubread vignette. They have some information on extracting information about the annotation.

ADD REPLY
0
Entering edit mode
bernatgel ▴ 150
@bernatgel-7226
Last seen 9 weeks ago
Spain

I'm late answering this question, but leaving this here just in case it useful to anyone.

You can create the plot you are asking for with karyoploteR. You could use either a simple kpPoints or make kpPlotManhattan work with you data. In any case, here's an example with DeSeq2 results on drosophila data. In this case y-axis is the fold change and bubble size is the p-value, but you should be able to easily adapt the code to your needs. Oh, and if you want to have all your chromosomes in a single line you'd only need to change a single parameter. You can find more information in the karyoploteR tutorial.

Manhattan like plot from DeSeq2 results created with karyoploteR

ADD COMMENT

Login before adding your answer.

Traffic: 609 users visited in the last hour
Help About
FAQ
Access RSS
API
Stats

Use of this site constitutes acceptance of our User Agreement and Privacy Policy.

Powered by the version 2.3.6