Entering edit mode

solanum
•
0
@solanum-22356
Last seen 4.2 years ago
Hi
I performed genome wide assoctiations (linear mixed model, using GENESIS) with about 640'000 SNPs and transformed phenotypic traits of 160 individuals. After correcting for population structure and kinship, all resulting Q-Q plots looked more or less like this:
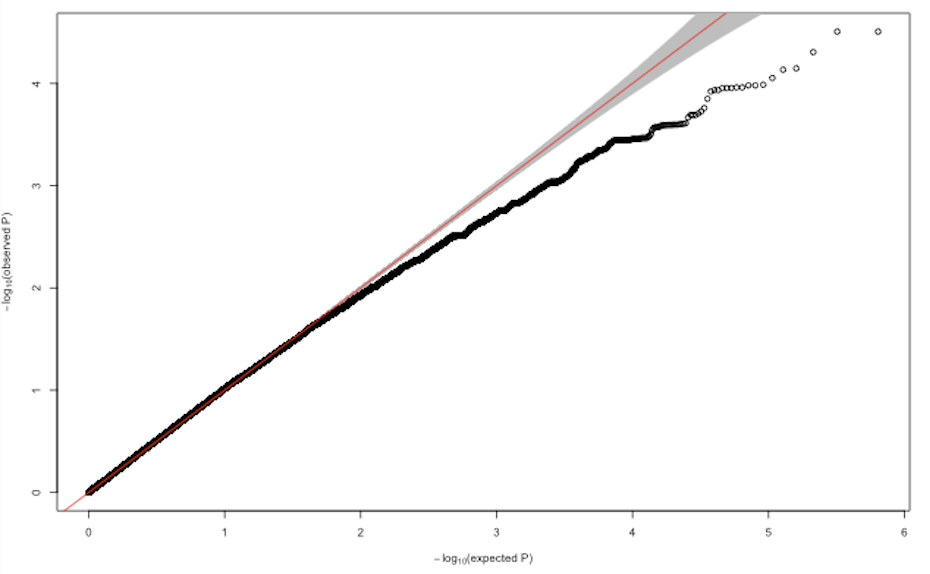
Does anybody have an idea what could possibly cause deflated p-value distributions in GWAS? Changing the number of PCs and adding different random effects did not substantially improve the model.
Many thanks in advance

Hello,
Have you performed any filtering on your 640,000 SNPs? You probably want to filter on quality, but also minor allele count (MAC). Single variant association tests for SNPs with very low MAC (e.g. < 10) generally will not perform well. Removing very low MAC SNPs may help your deflation issue.
Also, is your phenotype a quantitative or binary outcome? If it is binary (e.g. case/control), you may want to try the logistic mixed model by setting the family parameter = 'binomial'.
-Matt