
Hello everyone,
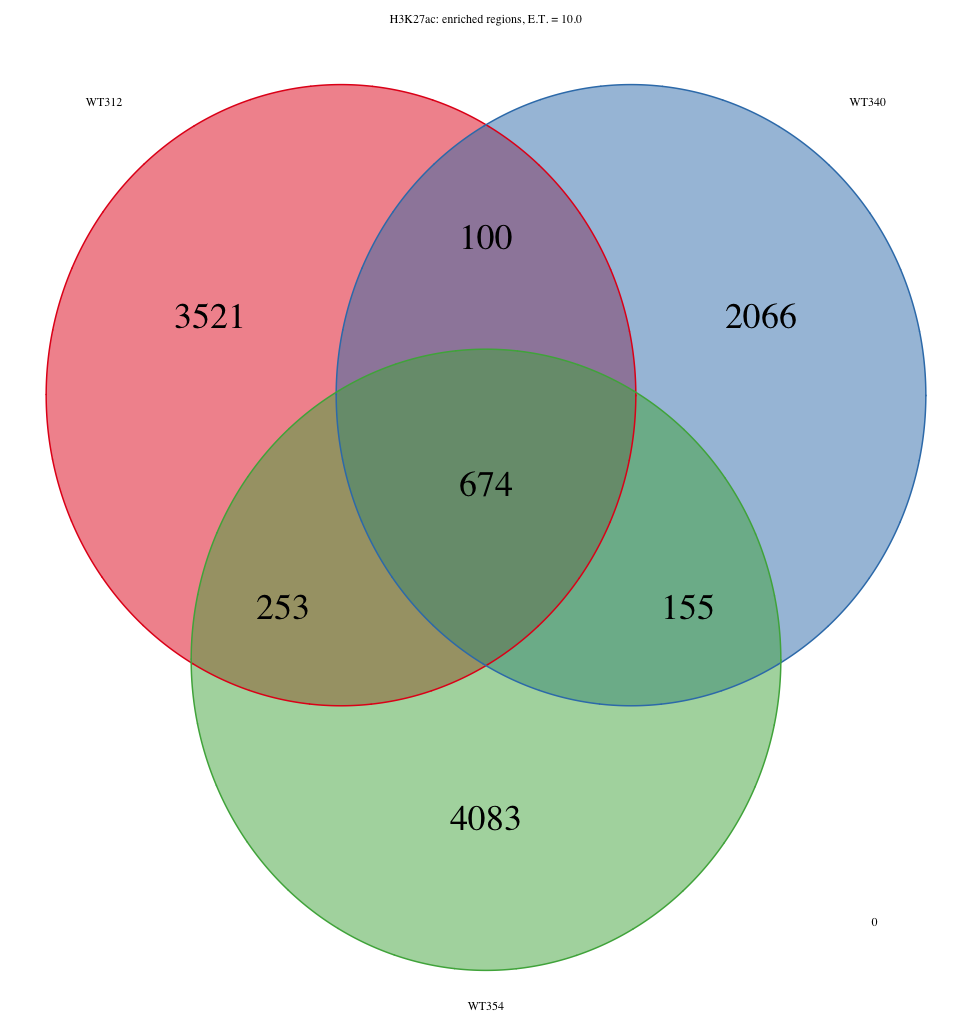
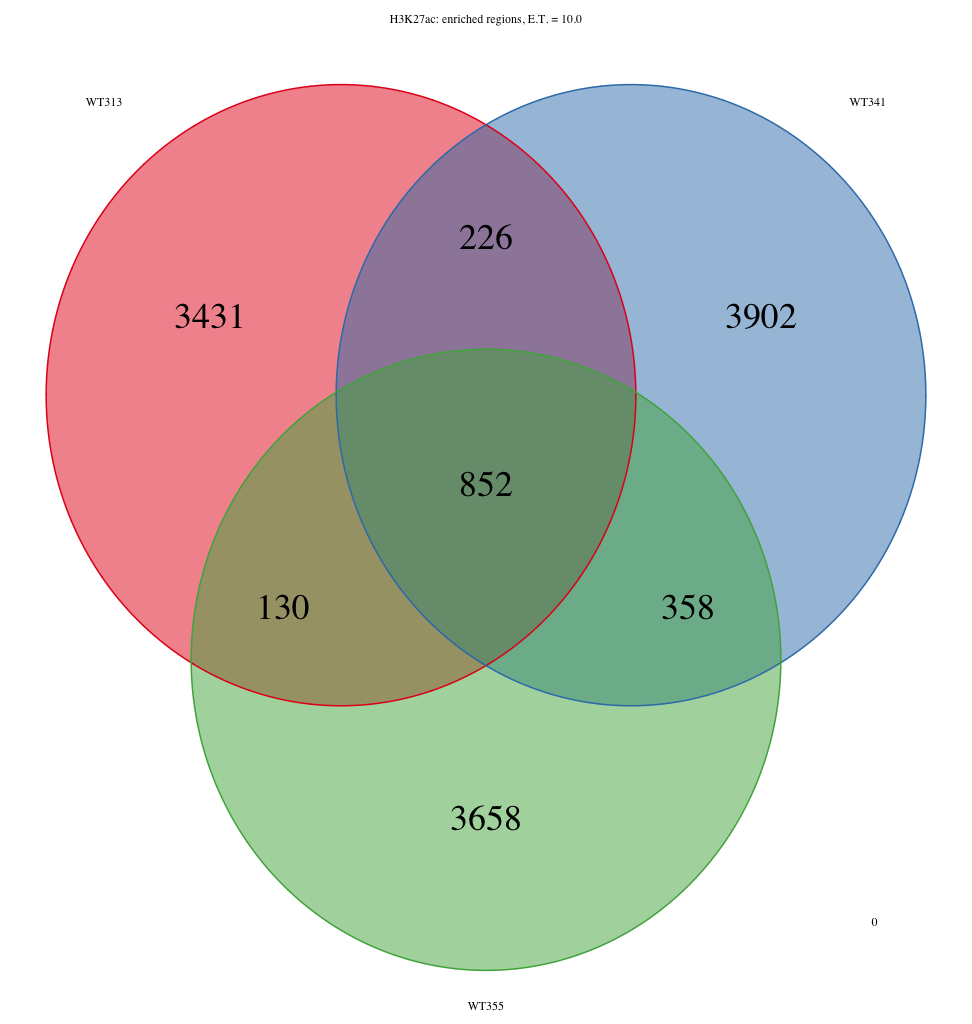
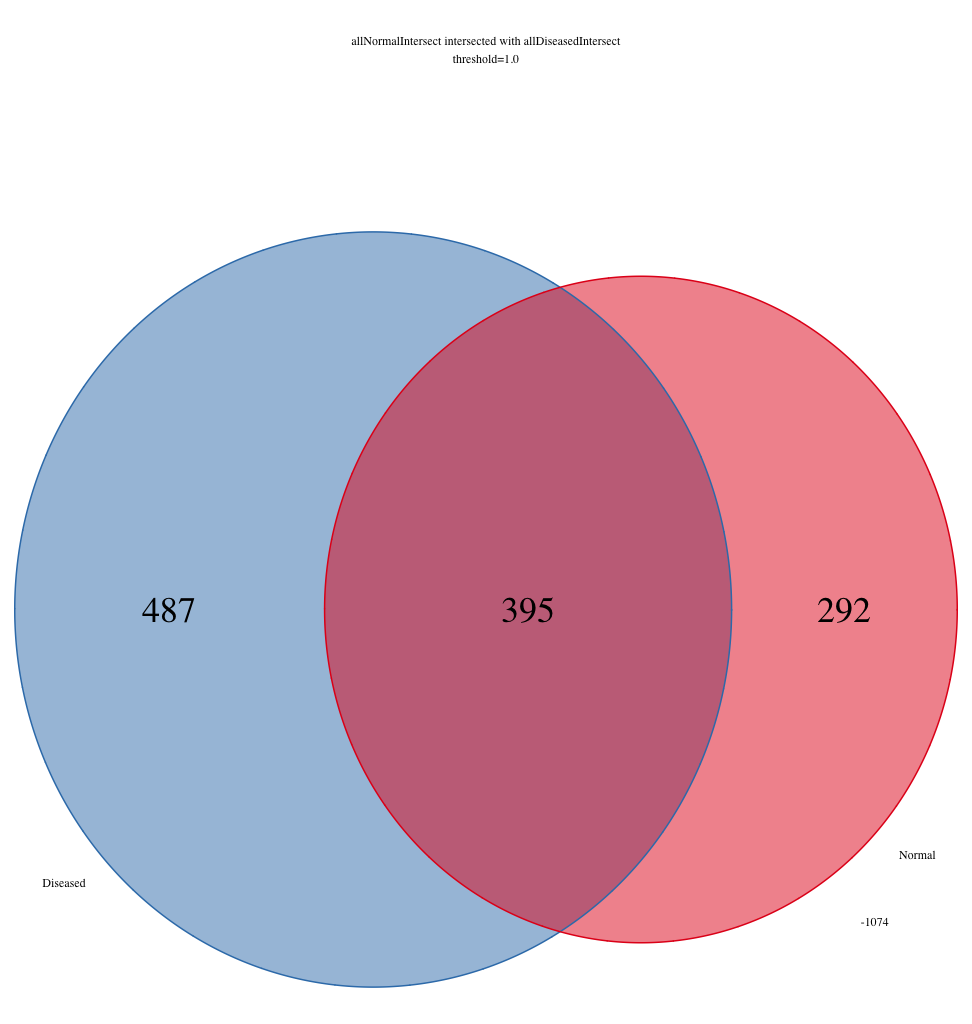
I am getting some surprising behaviour out of the ChIPpeakAnno R package. The question I’m trying to ask is ‘Which features intersect between samples ‘WT312’, ‘WT340’, and ‘WT354’, that also intersect with the intersection between samples ‘WT313’, ‘WT341’, and ‘WT355’. To visualize this, I am using makeVennDiagram to create two three-way venn diagrams: one for samples ‘WT312’, ‘WT340’, and ‘WT354’, and one for samples ‘WT313’, ‘WT341’, and ‘WT355’. Then I use findOverlappingPeaks to make an intersection of WT312, WT340, and WT354, which I call WT312_WT340_WT354. Separately, I also use findOverlappingPeaks to make an intersection of WT313, WT341, and WT355, which I call WT313_WT341_WT355. Then I take these two three-way intersected lists and pass those back through to makeVennDiagrams. The issue is that the total number of elements contained within the three-way venn diagrams for WT312-WT340-WT354 and WT313-WT341-WT355 do not sum up to the total number of elements from the two-way venn diagram. I’m attaching three PNG files to show what I’m talking about. Specifically, the number of elements that are found in WT312-WT340-WT354 in the two-way venn diagram exceeds the number of elements found to intersect between WT312-WT340-WT354 in the three-way venn diagram. The same basic story exists for WT313-WT341-WT355.
I can’t understand what would cause this behaviour, but it is a bit concerning for me. The intersection between the sets WT312-WT340-WT354 and WT313_WT341_WT355 should exactly sum to the intersection of the set WT312-WT340-WT354 and the the intersection of set WT313-WT341-WT355.
I'm pasting image links so you can see what I'm referring to.
487+395 = 882, not 852
and
292+395 = 687, not 674
Thanks,
Brad Davis

Hi Jianhong,
Thanks for pointing me to the latest development version of ChIPpeakAnno. I am trying to use it but I have encountered what appears to be a bug. While trying to use the function findOverlappingPeaks I get an error indicating that it cannot find the function .Deprecated. I've pasted the snippet of code and error message below.
> WT312_WT340c= findOverlappingPeaks(WT312c, WT340c, select="all", connectedPeaks="keepAll")
Error in findOverlappingPeaks(WT312c, WT340c, select = "all", connectedPeaks = "keepAll") :
could not find function ".Deprected"
Do you have any suggestions on how to deal with this?
Thanks,
Brad
Edit: A partial solution to this seems to be to use findOverlapsOfPeaks instead of findOverlappingPeaks; however, it doesn't allow me to do what I was hoping to do. I was using findOverlappingPeaks in a two step process to intersect three sets of intervals (and I did that twice on two separate sets of three sets of intervals). Then I used the resulting two sets of intervals to make a two-way venn diagram. Below is a snippet of code illustrating what I was doing:
#intersect normal peaks
WT312_WT340c= findOverlappingPeaks(WT312c, WT340c, select="all")
WT312_WT340_WT354c = findOverlappingPeaks(WT312_WT340c$MergedPeaks, WT354c, select="all")
#intersect disease peaks
WT313_WT341c= findOverlappingPeaks(WT313c, WT341c, select="all")
WT313_WT341_WT355c = findOverlappingPeaks(WT313_WT341c$MergedPeaks, WT355c, select="all")
#make two way venn diagram
makeVennDiagram(RangedDataList(WT312_WT340_WT354c$MergedPeaks, WT313_WT341_WT355c$MergedPeaks), NameOfPeaks=c("Normal", "Diseased"), fill=twocolors, col=twocolors, totalTest=100, main="allNormalIntersect intersected with allDiseasedIntersect\nthreshold=1.0", cex=3.0)
There doesn't seem to be any way to do this with findOverlapOfPeaks, because it doesn't return a list of peaks in a format that can be used with makeVennDiagrams, nor can I use the output of findOverlapsOfPeaks as input for a second round of findOverlapOfPeaks.
Do you see what I'm trying to accomplish?
Thanks for reporting the bug. It is fixed. You could download the new devel version from http://pgfe.umassmed.edu/ChIPpeakAnno/ now.
For the new version, you can try:
WT312_WT340_WT354c.ol <- findOverlapsOfPeaks(WT312c, WT340c, WT354c, maxgap=0)
WT313_WT341_WT355c.ol <- findOverlapsOfPeaks(WT313c, WT341c, WT355c, maxgap=0)
WT312_WT340_WT354c <- WT312_WT340_WT354c.ol$peaklist$`WT312c///WT340c///WT354c`
WT313_WT341_WT355c <- WT313_WT341_WT355c.ol$peaklist$`WT313c///WT341c///WT355c`
ol <- findOverlapsOfPeaks(WT312_WT340_WT354c, WT313_WT341_WT355c, maxgap=0, connectedPeaks="keepAll")
makeVennDiagram(ol, NameOfPeaks=c("Normal", "Diseased"), fill=twocolors, col=twocolors, main="allNormalIntersect intersected with allDiseasedIntersect\nthreshold=1.0", cex=3.0)
Let me known it work or not.
Hi Jianhong,
Thank you for your quick response. I have installed the latest version of ChIPpeakAnno and I am trying out the example code you have provided me.
What is the best way for me to make the two three-way venn diagrams so that they are comparable with this two-way venn diagram? My gut reaction is to use
makeVennDiagram(RangedDataList(WT312c, WT340c, WT354c), NameOfPeaks=c("WT312", "WT340", "WT354"),fill=brewer.pal(n=3, "Set1"), col=brewer.pal(n=3, "Set1"),scaled=FALSE, totalTest=100, euler.d=F, main=sprintf("%s: enriched regions, E.T. = %2.1f", mark, threshold), cex=3.0, connectedPeaks="keepAll");
Would it be easier if I sent you the bed files I'm working with?
It will be great if you can send me the bed files you are working at. I really want some real data to test my code.
Another thing, you need to determine the total test number by yourself, for example some reasonable number of possible binding sites.
Hi Jianhong,
I've tried the latest version of the code and worked through your example, but the numbers still do not add up correctly. The total number of peaks in the two way venn diagram (i.e. both for WT313_WT313_WT355 alone and the intersection between WT313_WT341_WT355 and WT312_WT340_WT354) does not equal the number of peaks identified in the intersection between WT313, WT341, and WT355 in the three way venn diagram. The numbers are off by a few hundred. For example, for the diseased samples (WT313, WT341. WT355), the number of features in the two-way venn diagram are 2149 and 1163 (1217.1245) for the diseased exclusive and the intersection, respectively), while the number of features for the three way venn diagram for the diseased samples equals 3502 (4030/3740/3927). I can send you the bed files that I am working with if that would help.
Brad
could you show me the output of
ol$venn_cnt
WT312_WT340_WT354c.ol$venn_cnt
WT313_WT341_WT355c.ol$venn_cnt