Entering edit mode

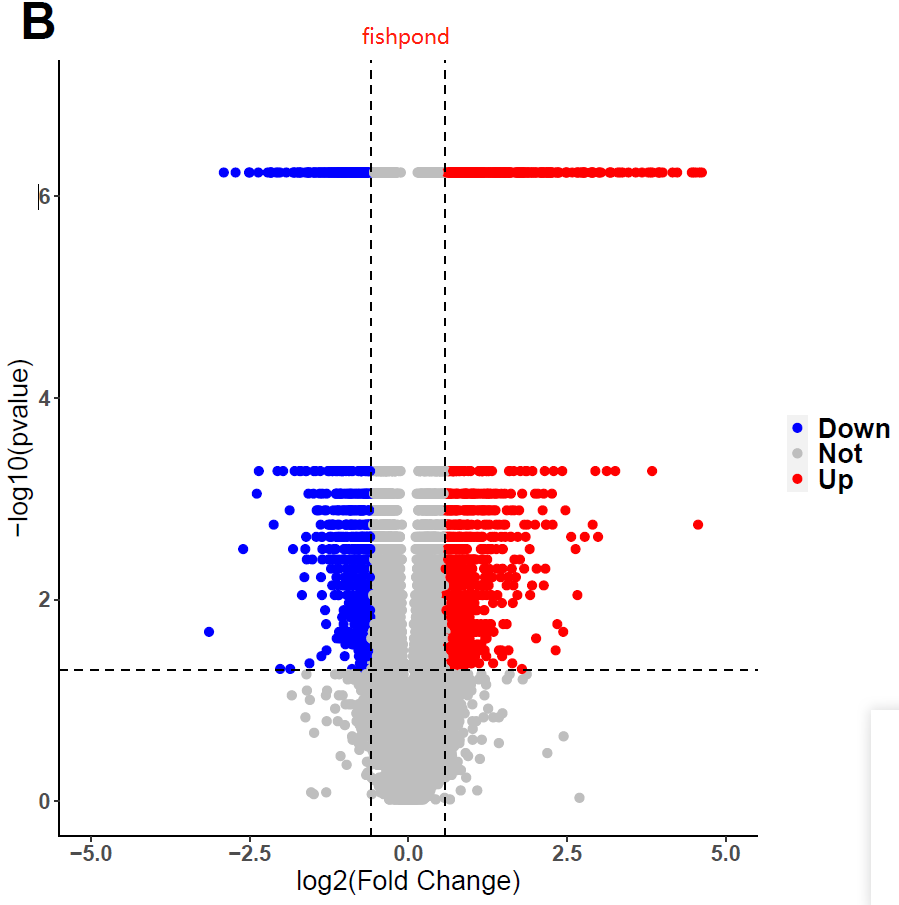
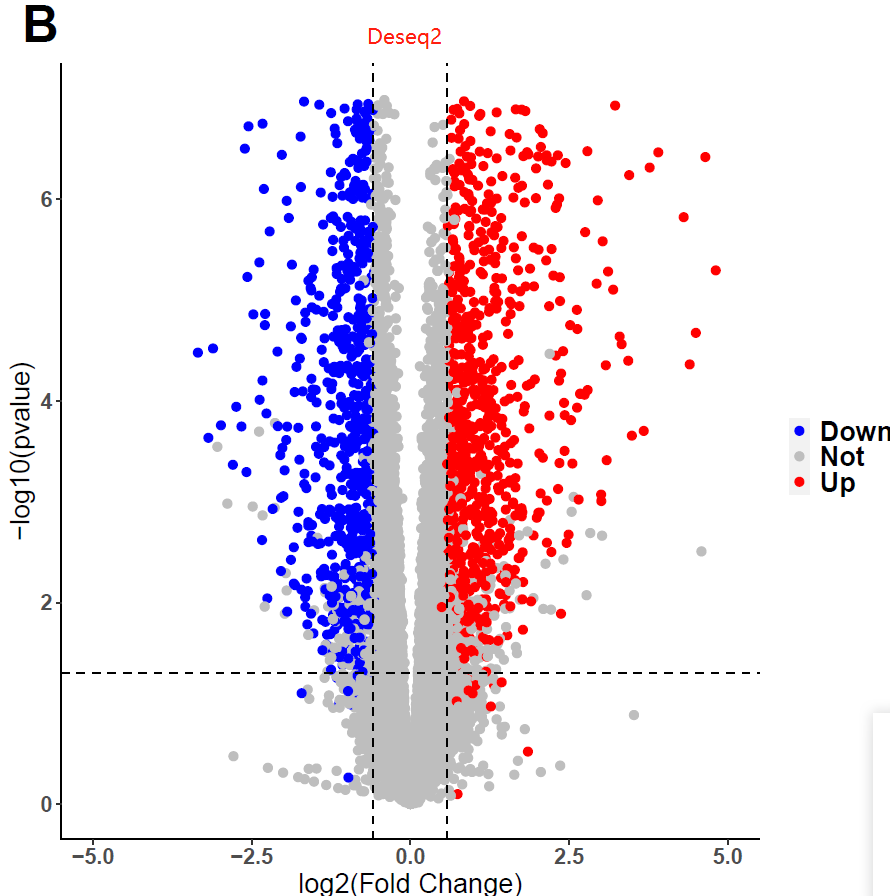
I used fishpond for DEGs analysis, but I obtained weird pvalue. I tried many datasets and parameters, still in vain. Interestingly, I found I would get conventional distribution of pvalues, if i used DESeq2 instead of fishpond. Does fishpond lead these? Are the results of fishpond Credible? Or, did I select unfit parameters? If you want the codes, I can send to you!
Best, Seager
#1 Part of quant's codes
######################################
    if [[ $LIB -eq 2 ]]; then # Check whether the library is paired
    salmon quant \
        -i $indexdir \
        -l A \
        -1 $workdir/fastq/$line".read1.fq" \
        -2 $workdir/fastq/$line".read2.fq" \
        -p 44 \
        -o $workdir/salmon_out/quant_out/$line \
        -g $gtfpath \
        --numGibbsSamples 5 \
        --auxDir aux_info \
        --seqBias --gcBias -d --posBias --hardFilter --discardOrphansQuasi --writeUnmappedNames && echo salmon $line Done!
        # note: rabbitQC(ktrim) outputs with suffix, "read1.fa" and "read2.fq"; change "--dumpEq" to "-d";add "--hardFilter" and "--discardOrphansQuasi"; "-l ISR"  to "-l A"
    date

    else

    salmon quant \
        -i $indexdir \
        -l A \
        -r $workdir/fastq/$line".read.fq" \
        -p 44 \
        -o $workdir/salmon_out/quant_out/$line \
        -g $gtfpath \
        --numGibbsSamples 5 \
        --auxDir aux_info \
        --seqBias --gcBias -d --posBias --hardFilter --discardOrphansQuasi --writeUnmappedNames && echo salmon $line Done!
        # note: rabbitQC(ktrim) outputs with suffix, "read1.fa" and "read2.fq"; change "--dumpEq" to "-d";add "--hardFilter" and "--discardOrphansQuasi"; "-l ISR"  to "-l A"
    date
    fi
######################################

#2 codes of fishpond
library(tximeta)
library(fishpond)
library(data.table)
library(tidytable)
library(DESeq2)
suppressPackageStartupMessages(library(SummarizedExperiment))
dir<- "/home2/ymwang/linqin/RNA-seq/Analysis/GSE112055_t2/salmon_out/"
pdata <- fread("dataset_TAC.txt", sep="\t", header=T)

##1 coldata <-  pdata %>% drop_na.(Day) %>% filter.(`Series ID` == "GSE66630" | `Series ID` == "GSE112055") ## Just use RNA-seq samples with days and  GSE66630&GSE112055
coldata <-  pdata %>% drop_na.(Day) %>% filter.(`Series ID` == "GSE112055") ## Just use RNA-seq samples with days and GSE112055


colnames(coldata)[grep("Run$",colnames(coldata))] <-"names" ## Note: fishpond need colnames "names"
head(coldata)
coldata$files <- file.path(dir, "quant_out",coldata$names, "quant.sf")
all(file.exists(coldata$files))

head(coldata)
makeLinkedTxome(
    indexDir = "/home2/ymwang/linqin/RNA-seq/Genome/release102/mouse/index_mouse_r102_gffread_salmon_k31",
    source = "Ensembl",
    organism = "Mus musculus",
    release = "102",
    genome = "GRChm38",
    fasta = "/home2/ymwang/linqin/RNA-seq/Genome/release102/mouse/transcript_gffread.fa",
    gtf = "/home2/ymwang/linqin/RNA-seq/Genome/release102/mouse/Mus_musculus.GRCm38.102.gtf",
    write = FALSE
)

se <- tximeta(coldata) # delete skipMeta=TRUE
assayNames(se)
head(rownames(se))
se
class(se)
cat("tximeta OK!")

##2 differential expression analysis at gene level
gse <- summarizeToGene(se)

#2.1 fishpond
y <- gse[,gse$Condition %in% c("Sham-w5", "TAC-w5")]
y$Condition <- factor(y$Condition, c("Sham-w5", "TAC-w5")) #the ordering of 'Sham' and 'TAC' will determine the log2FC(here is log2(TAC/Sham))
y
y <- scaleInfReps(y)
y <- labelKeep(y)
y <- y[mcols(y)$keep,]
cat("scaleInfReps-labelKeep OK!")
set.seed(910)
out <- swish(y, x="Condition", nperms=100)
out
head(mcols(out))
cat("swish OK!")
res1 <- as_tidytable(mcols(out))
# fwrite(res1,'DEGs_gse112055_fishpond.txt',sep="\t",quote=F)
cat("fishpond OK!")

#2.2 deseq2
dds <- DESeqDataSet(y, design = ~ Condition) # y getting from above
dds <- DESeq(dds)
dds$Condition <- factor(dds$Condition, levels =c("Sham-w5", "TAC-w5"))
res2 <- results(dds)
res2

##3 plot
library(data.table)
library(tidytable)
library(ggplot2)
require(grid)
library(Rmisc)

## fishpond
data <- res1
threshold <- as.factor(ifelse(data$pvalue <= 0.05 & abs(data$log2FC) >= log2(1.5) , ifelse(data$log2FC >= log2(1.5) ,'Up','Down'),'Not'))
pdf("plot1.pdf")
ggplot(data,aes(x=log2FC,y=-log10(pvalue),colour=threshold)) +
    xlab("log2(Fold Change)")+ylab("-log10(pvalue)") +
    geom_point(size = 2,alpha=1) +
    ylim(0,7) + xlim(-5,5) +
    scale_color_manual(values=c("blue","grey", "red"))+
    geom_vline(xintercept = c(-log2(1.5), log2(1.5)), lty = 2,colour="#000000")+
    geom_hline(yintercept = c(-log10(0.05)), lty = 2,colour="#000000") +
    ggtitle("B") +
    guides(fill = guide_legend(reverse = F))+
    theme(plot.title = element_text(hjust = -0.06,size = 28, face = "bold"),
          legend.title = element_blank(),
          legend.text = element_text(size = 15, face = "bold"),
          legend.position = 'right',
          legend.key.size=unit(0.4,'cm'))+
    theme(panel.grid.major =element_blank(), panel.grid.minor = element_blank(),panel.background = element_blank(), axis.line = element_line(colour = "black"),axis.text=element_text(size=12,face = "bold"),axis.title.x=element_text(size=15),axis.title.y=element_text(size=15))

dev.off()

# deseq2, note: log2FoldChange in deseq2
data <- data.frame(res2)
pdf("plot2.pdf")
ggplot(data,aes(x=log2FoldChange,y=-log10(pvalue),colour=threshold)) +
    xlab("log2(Fold Change)")+ylab("-log10(pvalue)") +
    geom_point(size = 2,alpha=1) +
    ylim(0,7) + xlim(-5,5) +
    scale_color_manual(values=c("blue","grey", "red"))+
    geom_vline(xintercept = c(-log2(1.5), log2(1.5)), lty = 2,colour="#000000")+
    geom_hline(yintercept = c(-log10(0.05)), lty = 2,colour="#000000") +
    ggtitle("B") +
    guides(fill = guide_legend(reverse = F))+
    theme(plot.title = element_text(hjust = -0.06,size = 28, face = "bold"),
          legend.title = element_blank(),
          legend.text = element_text(size = 15, face = "bold"),
          legend.position = 'right',
          legend.key.size=unit(0.4,'cm'))+
    theme(panel.grid.major =element_blank(), panel.grid.minor = element_blank(),panel.background = element_blank(), axis.line = element_line(colour = "black"),axis.text=element_text(size=12,face = "bold"),axis.title.x=element_text(size=15),axis.title.y=element_text(size=15))

dev.off()


print("All done!")

sessionInfo()
R version 4.0.2 (2020-06-22)
Platform: x86_64-conda_cos6-linux-gnu (64-bit)
Running under: CentOS Linux 7 (Core)

Matrix products: default
BLAS/LAPACK: /home2/ymwang/miniconda3/envs/R40/lib/libopenblasp-r0.3.12.so

locale:
 [1] LC_CTYPE=en_US.UTF-8       LC_NUMERIC=C
 [3] LC_TIME=en_US.UTF-8        LC_COLLATE=en_US.UTF-8
 [5] LC_MONETARY=en_US.UTF-8    LC_MESSAGES=en_US.UTF-8
 [7] LC_PAPER=en_US.UTF-8       LC_NAME=C
 [9] LC_ADDRESS=C               LC_TELEPHONE=C
[11] LC_MEASUREMENT=en_US.UTF-8 LC_IDENTIFICATION=C

attached base packages:
 [1] grid      parallel  stats4    stats     graphics  grDevices utils
 [8] datasets  methods   base

other attached packages:
 [1] Rmisc_1.5                   plyr_1.8.6
 [3] lattice_0.20-44             ggplot2_3.3.5
 [5] DESeq2_1.30.1               SummarizedExperiment_1.20.0
 [7] Biobase_2.50.0              MatrixGenerics_1.2.1
 [9] matrixStats_0.60.1          GenomicRanges_1.42.0
[11] GenomeInfoDb_1.26.7         IRanges_2.24.1
[13] S4Vectors_0.28.1            BiocGenerics_0.36.1
[15] tidytable_0.6.5             data.table_1.14.0
[17] fishpond_1.6.0              tximeta_1.9.5

loaded via a namespace (and not attached):
  [1] colorspace_2.0-2              ellipsis_0.3.2
  [3] qvalue_2.22.0                 XVector_0.30.0
  [5] rstudioapi_0.13               farver_2.1.0
  [7] bit64_4.0.5                   interactiveDisplayBase_1.28.0
  [9] AnnotationDbi_1.52.0          fansi_0.5.0
 [11] xml2_1.3.2                    splines_4.0.2
 [13] tximport_1.18.0               cachem_1.0.6
 [15] geneplotter_1.68.0            jsonlite_1.7.2
 [17] Rsamtools_2.6.0               annotate_1.68.0
 [19] dbplyr_2.1.1                  shiny_1.6.0
 [21] BiocManager_1.30.16           readr_2.0.1
 [23] compiler_4.0.2                httr_1.4.2
 [25] assertthat_0.2.1              Matrix_1.3-4
 [27] fastmap_1.1.0                 lazyeval_0.2.2
 [29] cli_3.0.1                     later_1.3.0
 [31] htmltools_0.5.2               prettyunits_1.1.1
 [33] tools_4.0.2                   gtable_0.3.0
 [35] glue_1.4.2                    GenomeInfoDbData_1.2.4
 [37] reshape2_1.4.4                dplyr_1.0.7
 [39] rappdirs_0.3.3                Rcpp_1.0.7
 [41] vctrs_0.3.8                   Biostrings_2.58.0
 [43] rtracklayer_1.50.0            stringr_1.4.0
 [45] mime_0.11                     lifecycle_1.0.0
 [47] ensembldb_2.14.1              gtools_3.9.2
 [49] XML_3.99-0.7                  AnnotationHub_2.22.1
 [51] zlibbioc_1.36.0               scales_1.1.1
 [53] vroom_1.5.4                   hms_1.1.0
 [55] promises_1.2.0.1              ProtGenerics_1.22.0
 [57] AnnotationFilter_1.14.0       RColorBrewer_1.1-2
 [59] yaml_2.2.1                    curl_4.3.2
 [61] memoise_2.0.0                 biomaRt_2.46.3
 [63] stringi_1.7.4                 RSQLite_2.2.8
 [65] BiocVersion_3.12.0            genefilter_1.72.1
 [67] GenomicFeatures_1.42.3        BiocParallel_1.24.1
 [69] rlang_0.4.11                  pkgconfig_2.0.3
 [71] bitops_1.0-7                  purrr_0.3.4
 [73] labeling_0.4.2                GenomicAlignments_1.26.0
 [75] bit_4.0.4                     tidyselect_1.1.1
 [77] magrittr_2.0.1                R6_2.5.1
 [79] generics_0.1.0                DelayedArray_0.16.3
 [81] DBI_1.1.1                     pillar_1.6.2
 [83] withr_2.4.2                   survival_3.2-13
 [85] abind_1.4-5                   RCurl_1.98-1.4
 [87] tibble_3.1.4                  crayon_1.4.1
 [89] utf8_1.2.2                    BiocFileCache_1.14.0
 [91] tzdb_0.1.2                    progress_1.2.2
 [93] locfit_1.5-9.4                blob_1.2.2
 [95] digest_0.6.27                 xtable_1.8-4
 [97] httpuv_1.6.3                  openssl_1.4.5
 [99] munsell_0.5.0                 askpass_1.1

Thans for your reply. I'm sorry for reply so late, because I didn't getting any messages in my email. I will read details of the vignette.