Entering edit mode

I'm not sure what Im doing wrong since I have used the code many times before the row names doesn't show up although that is assigned to in my code.
I have tried putting the row-name both left and right side but it still doesn't show up Code should be placed in three backticks as shown below
 heat <- t(scale(t(df[,3:ncol(df)])))

    head(heat)

    rownames(heat) <- df$Gene
    ColAnn <- data.frame(colnames(heat))
    Sample = c(rep("ACE2_MOCK",1),rep("ACE2_IRGM_KO_MOCK",1))

    anno <- as.data.frame(Sample)
    categories <- data.frame(anno)
    colnames(anno) <- c("Condition")
    ColAnn <- HeatmapAnnotation(df=anno,which="col", col=list(Condition=c("ACE2_MOCK"="black","ACE2_IRGM_KO_MOCK"="red")))


    RowAnn <- data.frame(df$Family)
    colnames(RowAnn) <- c("Gene family")
    colours <- list("Gene family"=c("Diff_gene" = "white"))


    RowAnn <- HeatmapAnnotation(df=RowAnn, col=colours, which="row")
    boxAnnCol <- HeatmapAnnotation(boxplot=anno_boxplot(heat, border=TRUE, gp=gpar(fill="#CCCCCC"),
                                                        pch=".", size=unit(2, "mm"),
                                                        axis=TRUE,  axis_param = list(side = "left")),
                                   annotation_width=unit(c(1, 6.5), "cm"))


    myCol <- colorRampPalette(c("navyblue", "white", "red"))(100)
    myBreaks <- seq(-0.5, 0.5, length.out=100)
    myBreaks
    hmap <- Heatmap(heat,
                    name="Z-score",
                    col=colorRamp2(myBreaks, myCol),
                    #heatmap_legend_param=list(color_bar="continuous",
                    #                         legend_direction="vertical", legend_width=unit(5,"cm"),
                    #                        title_position="lefttop", title_gp=gpar(fontsize=10, fontface="bold")),

                    #Split heatmap rows by gene family
                    #split=df$Family,
                    #split = NULL,
                    #km = 4,
                    #row_split = 7,
                    #row_km = 4,
                    #row_km_repeats = 100,
                    #row_title = "cluster_%s",
                    #row_title_gp = gpar(col = c("red", "blue","green","yellow","navyblue","violet","pink"), font = 1:2),
                    row_gap = unit(0, "mm"),
                    border = FALSE,
                    #Row annotation configurations
                    cluster_rows=TRUE,
                    show_row_dend=TRUE,
                    row_dend_side = "left",
                    #row_title="Transcript", #overridden by 'split' it seems
                    #row_title_side="left",
                    #row_title_gp=gpar(fontsize=8,fontface="bold"),
                    #row_names_gp = gpar(fontsize = 8),
                    show_row_names=TRUE,
                    row_names_side="right",
                    row_title_rot=0,

                    #Column annotation configuratiions
                    cluster_columns=FALSE,
                    show_column_dend=FALSE,
                    column_title="Samples",
                    column_title_side="top",
                    column_title_gp=gpar(fontsize=10, fontface="bold"),
                    column_title_rot=0,
                    column_names_gp = gpar(fontsize = 20, fontface="bold"),
                    show_column_names=TRUE,

                    #Dendrogram configurations: columns
                    clustering_distance_columns="euclidean",
                    clustering_method_columns="complete",
                    column_dend_height=unit(10,"mm"),

                    #Dendrogram configurations: rows
                    #clustering_distance_rows="euclidean",
                    clustering_distance_rows = "pearson",
                    clustering_method_rows="complete",
                    row_dend_width=unit(15,"mm"),

                    #top_annotation_height=unit(0.5,"cm"),
                    top_annotation=ColAnn,

                    #bottom_annotation_height=unit(2, "cm"),
                    bottom_annotation=boxAnnCol)

    hmap + RowAnn

# include y
# please also include the results of running the following in an R session
My dataframe used for this plot

    dput(df)
    structure(list(Family = structure(c(1L, 1L, 1L, 1L, 1L, 1L, 1L,
    1L, 1L, 1L, 1L, 1L, 1L, 1L, 1L, 1L, 1L, 1L, 1L, 1L, 1L, 1L, 1L,
    1L, 1L, 1L, 1L, 1L, 1L, 1L, 1L, 1L, 1L, 1L, 1L, 1L, 1L, 1L, 1L,
    1L, 1L, 1L, 1L, 1L, 1L, 1L, 1L, 1L, 1L, 1L, 1L, 1L), class = "factor", .Label = "Diff_gene"),
        gene = c("Apobec1", "Apobec3", "Bst2", "Ddx58", "Ddx60",
        "Gbp10", "Gbp11", "Gbp2", "Gbp2b", "Gbp3", "Gbp4", "Gbp5",
        "Gbp6", "Gbp7", "Gbp8", "Gbp9", "Irf4", "Irf7", "Irf9", "Irgm2",
        "Isg15", "Isg20", "Oas1a", "Oas1b", "Oas1c", "Oas1e", "Oas1g",
        "Oas2", "Oas3", "Oasl1", "Oasl2", "Ifi203", "Ifi204", "Ifi205",
        "Ifi207", "Ifi209", "Ifi213", "Ifi214", "Ifi27", "Ifi27l2a",
        "Ifi27l2b", "Ifi35", "Ifi44", "Ifih1", "Ifit1", "Ifit1bl1",
        "Ifit2", "Ifit3", "Ifit3b", "Ifitm3", "Zbp1", "Znfx1"), ACE2_MOCK = c(407.098476061909,
        1855.94866662715, 2902.87979118331, 1418.48768158987, 307.715152670574,
        5.30325977271867, 16.6258275641314, 1916.43808451318, 5.37642563822957,
        1186.2316535435, 1335.58823779077, 305.17848295847, 99.1645827545343,
        1757.32851199409, 194.008799582845, 1174.68142359132, 83.0351252864635,
        922.102271319543, 1996.60775743498, 1367.83617562333, 759.423540077501,
        1037.56327181345, 232.674297494372, 259.571063835334, 150.719320562386,
        5.072582464476, 71.359745330416, 567.465294501395, 89.6946379260825,
        126.119036502863, 1731.68835553741, 1646.65814253949, 138.75431484587,
        141.116325067812, 235.494888533203, 347.710689734509, 618.098320219156,
        11.9744562091738, 3747.04713625385, 2177.4137837713, 5.68707745603433,
        2088.56348903007, 413.345543446159, 866.822832248851, 1486.09638215541,
        155.425497292957, 528.828483791686, 1806.34726472835, 320.853994579289,
        8210.82040783904, 238.780701171051, 1938.47023785919), ACE2_IRGM_KO_MOCK = c(749.181940759016,
        2993.70562800799, 8793.06507227506, 2935.66672238197, 1231.25630555463,
        57.7973443352929, 115.653747983434, 5552.3040666907, 16.8963656095157,
        5055.50008201252, 3567.50362240923, 1424.18048056808, 457.870814791012,
        4116.74672827908, 590.42192220289, 2867.08788857983, 220.517543547042,
        9912.18439436293, 4141.65152832592, 4971.031140377, 4857.80714988756,
        1740.4008718546, 1866.34498107905, 963.651479352654, 300.823456034431,
        24.4027803221429, 797.901766740012, 5978.13674870163, 1334.9339760727,
        1044.86971880756, 9272.23976035301, 4408.89883189086, 893.614402712474,
        349.75618607996, 626.559122115524, 1115.7496625029, 1889.66443188002,
        80.1402404741233, 6663.17351139748, 13444.1443794422, 11.7830381943685,
        3290.74444153149, 2713.19509099661, 2395.30081346767, 8963.21424851447,
        514.633361828127, 2452.5798999775, 11824.1253276475, 1987.20950755614,
        19271.4840719139, 2304.28156105082, 4325.00175274422)), class = "data.frame", row.names = c(NA,
    -52L))


sessionInfo( )


 R version 3.6.0 (2019-04-26)
    Platform: x86_64-redhat-linux-gnu (64-bit)
    Running under: CentOS Linux 7 (Core)

    Matrix products: default
    BLAS/LAPACK: /usr/lib64/R/lib/libRblas.so

    locale:
     [1] LC_CTYPE=en_US.UTF-8       LC_NUMERIC=C               LC_TIME=en_US.UTF-8        LC_COLLATE=en_US.UTF-8     LC_MONETARY=en_US.UTF-8
     [6] LC_MESSAGES=en_US.UTF-8    LC_PAPER=en_US.UTF-8       LC_NAME=C                  LC_ADDRESS=C               LC_TELEPHONE=C
    [11] LC_MEASUREMENT=en_US.UTF-8 LC_IDENTIFICATION=C

    attached base packages:
    [1] grid      stats     graphics  grDevices utils     datasets  methods   base

    other attached packages:
    [1] cluster_2.1.3        circlize_0.4.14      ComplexHeatmap_2.0.0 dplyr_1.0.8          readxl_1.4.0

    loaded via a namespace (and not attached):
     [1] rstudioapi_0.13     magrittr_2.0.3      hms_1.1.1           tidyselect_1.1.2    clue_0.3-60         colorspace_2.0-3    rjson_0.2.20
     [8] R6_2.5.1            rlang_1.0.2         fansi_1.0.3         tools_3.6.0         parallel_3.6.0      png_0.1-7           utf8_1.2.2
    [15] cli_3.2.0           DBI_1.1.2           ellipsis_0.3.2      assertthat_0.2.1    tibble_3.1.6        lifecycle_1.0.1     crayon_1.5.1
    [22] RColorBrewer_1.1-3  purrr_0.3.4         readr_2.1.2         tzdb_0.3.0          GlobalOptions_0.1.2 vctrs_0.4.1         shape_1.4.6
    [29] glue_1.6.2          compiler_3.6.0      pillar_1.7.0        cellranger_1.1.0    generics_0.1.2      GetoptLong_1.0.5    pkgconfig_2.0.3
Output im getting
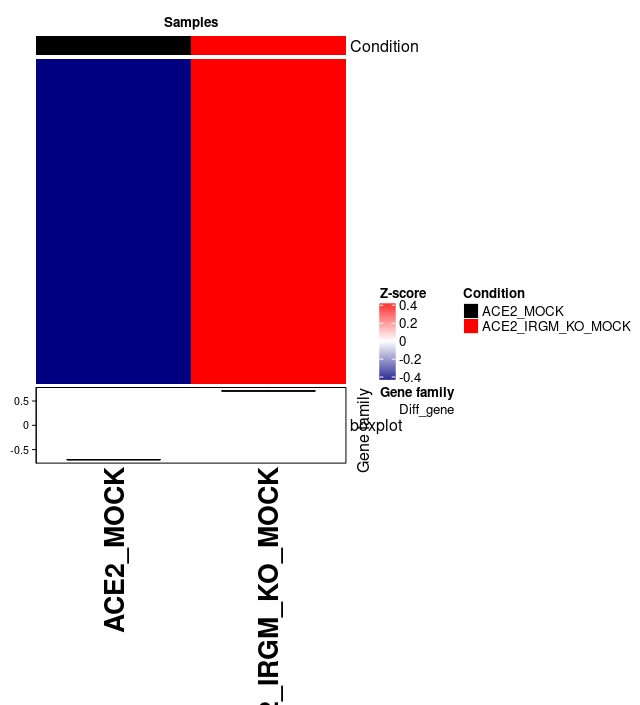


and i finally i saw my mistake