I'm new to R and am making a heatmap for some RNA sequencing data using p.heatmap. My input data is the Log2CPM of genes across 5 samples (samples in columns, genes in rows). I want to understand whether I should scale my data or not, using the scale() function. And secondly, if I should set scale="row" in the p.heatmap function or not. Here is my code:
install.packages("pheatmap")
library(pheatmap)
heatmap_trial_2 <- read.csv("Final genes_log2CPM.csv")
heatmap_trial_2 <- data.frame(heatmap_trial_2[,-1], row.names=heatmap_trial_2[,1])
sc_1 <-t(scale(t(heatmap_trial_2), center = TRUE, scale = TRUE))
pheatmap(sc_1, kmeans_k = NA, breaks = NA, scale = "none", cluster_rows = FALSE,
         cluster_cols = FALSE,
         show_rownames = TRUE, show_colnames = TRUE,
         colorRampPalette(brewer.pal(9,"BuPu"))(100))
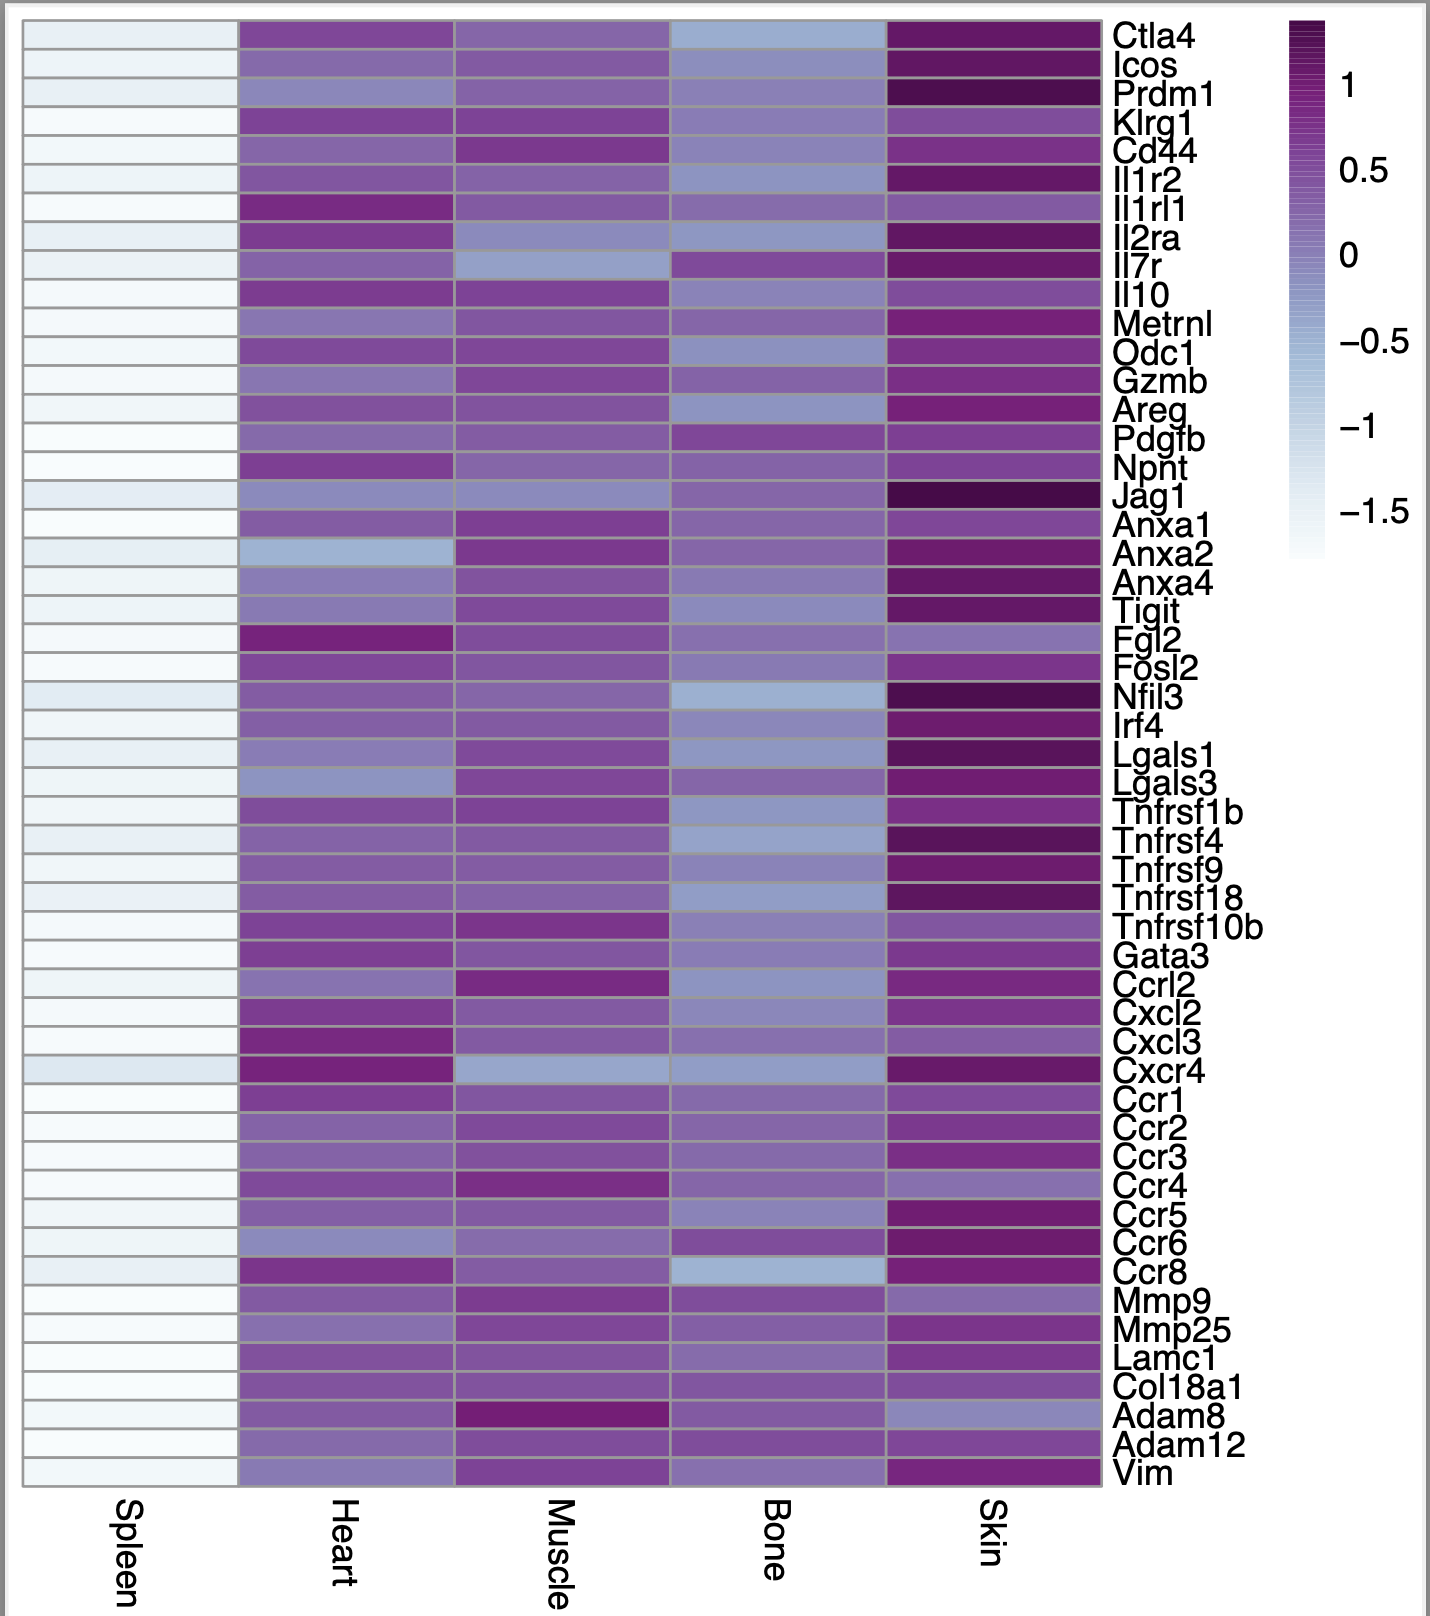
Here is the output I get when I put the above code
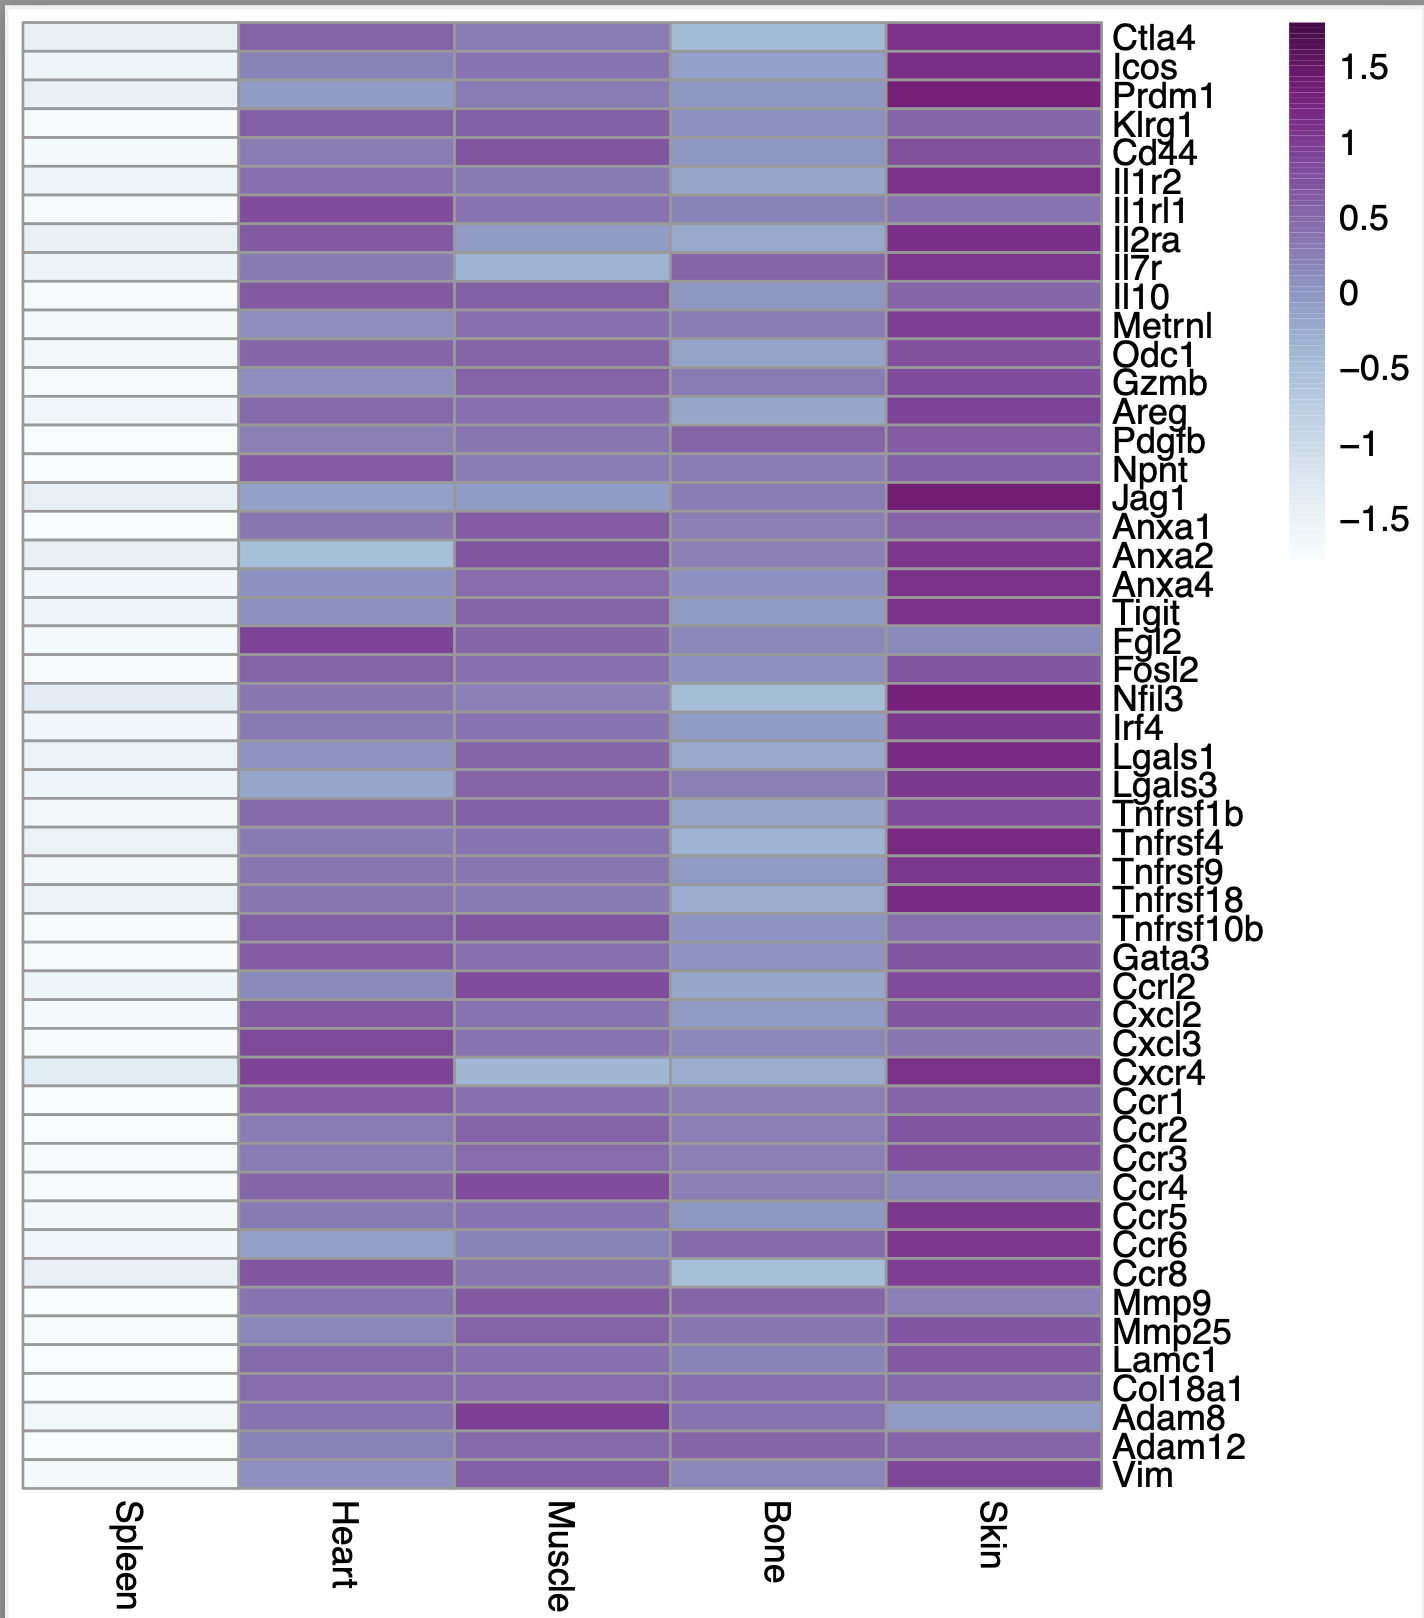
However, I noticed that if I set scale = "row" in the p.heatmap code, then the heatmap looks exactly the same regardless of whether i set scale = TRUE or scale = FALSE using the scale function. Here is what the heatmap looks like in that case:
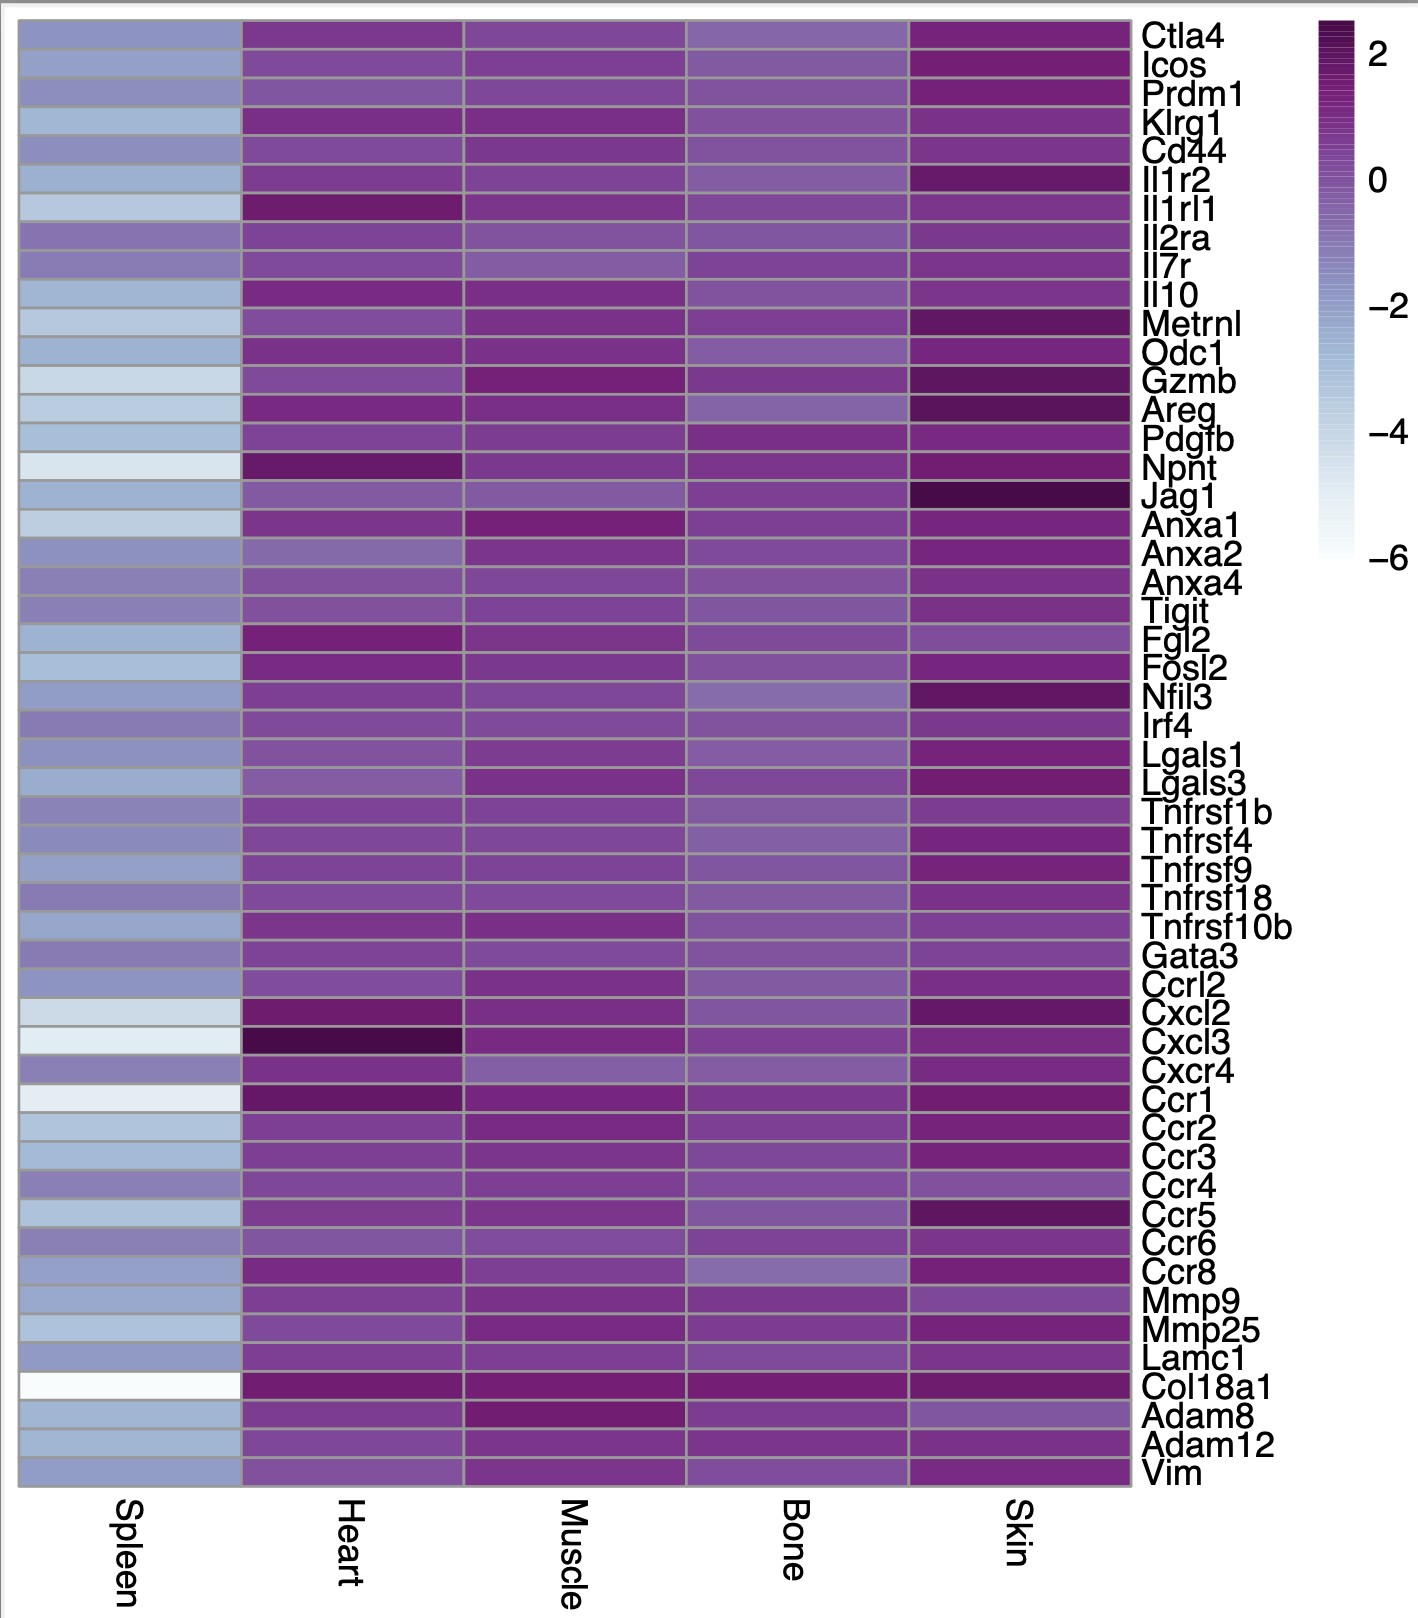
If I don't scale it at all (if I put scale=FALSE and scale="none"), this is what I get:
I do understand the purpose of scaling in general after reading the R documentation for both the functions and some other posts so I know I should be scaling my data, I am just struggling to determine which of these is the correct way to do it for my data. At what step should I perform the "scaling"? Any help would be highly appreciated, thanks!
my session info
sessionInfo( )
R version 4.1.2 (2021-11-01)
Platform: x86_64-apple-darwin17.0 (64-bit)
Running under: macOS Big Sur 11.6.2

Matrix products: default
LAPACK: /Library/Frameworks/R.framework/Versions/4.1/Resources/lib/libRlapack.dylib

locale:
[1] en_AU.UTF-8/en_AU.UTF-8/en_AU.UTF-8/C/en_AU.UTF-8/en_AU.UTF-8

attached base packages:
[1] stats     graphics  grDevices utils     datasets  methods   base

other attached packages:
[1] RColorBrewer_1.1-3 viridis_0.6.2      viridisLite_0.4.0  pheatmap_1.0.12

loaded via a namespace (and not attached):
 [1] magrittr_2.0.3   tidyselect_1.1.2 munsell_0.5.0    colorspace_2.0-3 R6_2.5.1         rlang_1.0.2      fansi_1.0.3      dplyr_1.0.9
 [9] tools_4.1.2      grid_4.1.2       gtable_0.3.0     utf8_1.2.2       DBI_1.1.3        cli_3.3.0        ellipsis_0.3.2   assertthat_0.2.1
[17] tibble_3.1.7     lifecycle_1.0.1  crayon_1.5.1     gridExtra_2.3    purrr_0.3.4      ggplot2_3.3.6    vctrs_0.4.1      glue_1.6.2
[25] compiler_4.1.2   pillar_1.7.0     generics_0.1.2   scales_1.2.0     pkgconfig_2.0.3


Okay, I understand...Thank you for the clarification! And thanks for pointing out that I need to update my versions :)