how to plot a fitting line on the testPseudotime
1
0
Entering edit mode
@shangguandong1996-21805
Last seen 18 months ago
China

Hi, I run the testPseudotime() according to the OSCA Changes along a trajectory. and I also plot the logExpression-Pseudotime plot.

But I am wondering whether I can fit a line for the plotExpression plot like below. Or I just use the geom_smooth to fit.

enter image description here

Best wishes

Guandong Shang

Pseudotime testPseudotime TSCAN SingleCell OSCA • 953 views
ADD COMMENT
0
Entering edit mode
Aaron Lun ★ 28k
@alun
Last seen 1 hour ago
The city by the bay

plotExpression just returns a ggplot object, so you should be able to add further custom layers on top using standard ggplot2 methods.

Alternatively, tradeSeq probably has some suitable visualization methods that you could look at.

ADD COMMENT
0
Entering edit mode

Hi, Aaron. I just wondering whehter I should choose suitable model to plot the fit line. Just as you say in OSCA

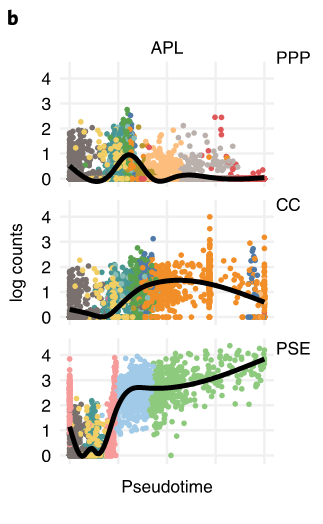
We use the testPseudotime() utility to fit a natural spline to the expression of each gene, allowing us to model a range of non-linear relationships in the data.

Should I plot a line that capture the non-linear relationship from the testPseudotime() ?

Please forgive me if I misunderstand something :)

Thanks again for your reply.

Best wishes

Guandong Shang

ADD REPLY

Login before adding your answer.

Traffic: 742 users visited in the last hour
Help About
FAQ
Access RSS
API
Stats

Use of this site constitutes acceptance of our User Agreement and Privacy Policy.

Powered by the version 2.3.6