Entering edit mode

Hello,
I have a proteomics data set with intensities of the proteins in each individual sample collected during 3 different time points of the experiment: Days 0, 15 and 30. Each subject was sampled repeatedly during each time point; there were 28 subjects in total.
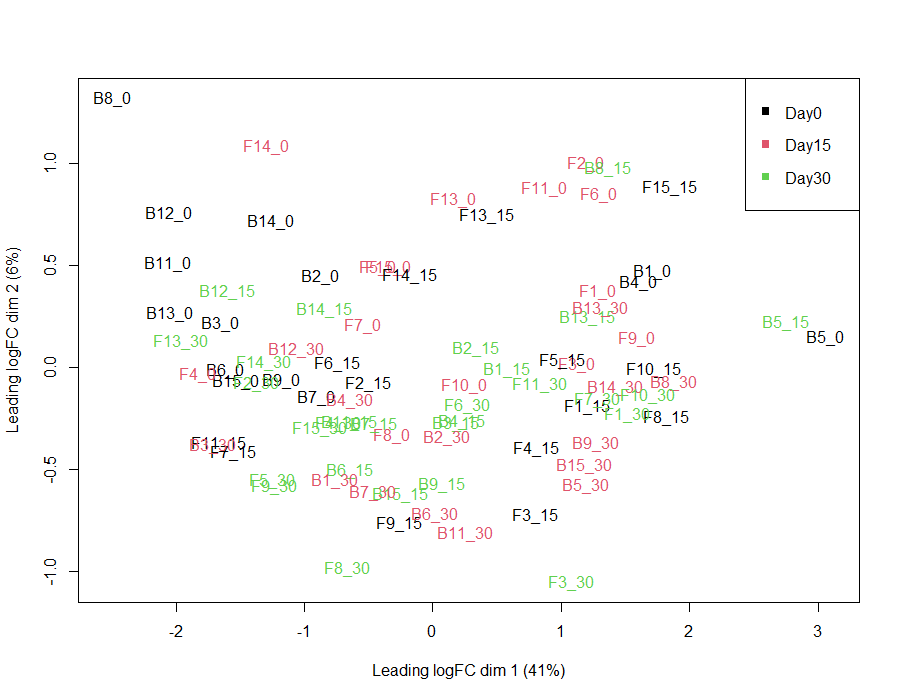
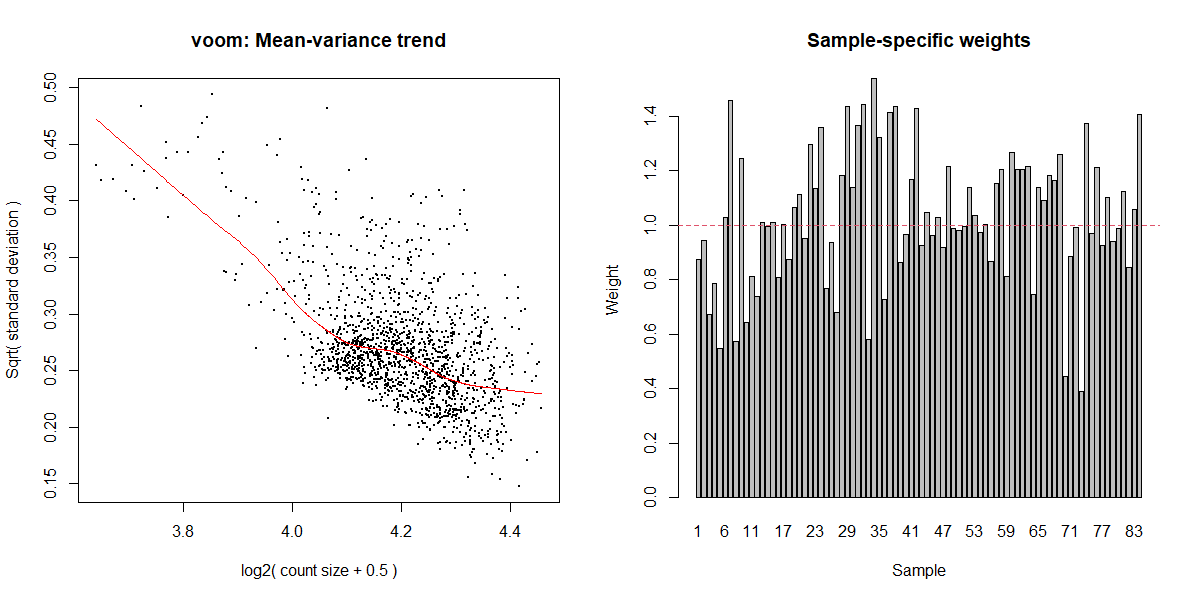
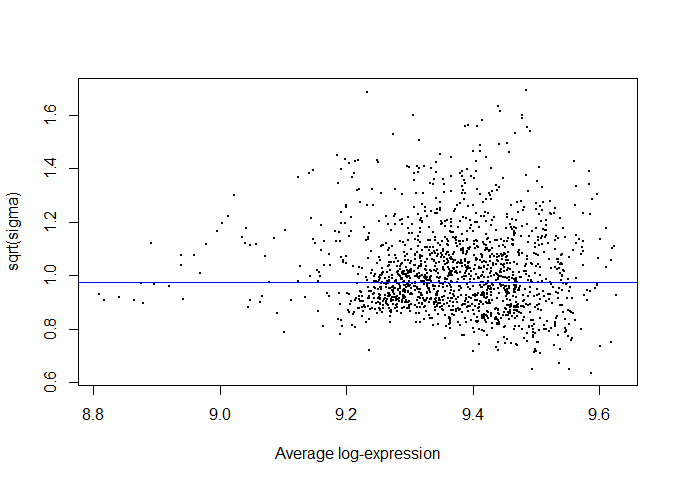
I was just wondering if my limma code could be validated, and if the mean-variance and residual variance plots seem okay? The DE protein lists coincide with what is observed in the MDS plot, however I'm not sure if my mean-variance plot is optimal.
Any feedback on what can be done to correct/improve is greatly appreciated!
#importing protein intensities, row=proteins, columns=SampleID
mc <- read.csv(file.choose(),header = T)

> head(mc)
  Sample      B1_0       B2_0      B3_0       B4_0      B5_0       B6_0      B7_0      B8_0
1     F3 233359.30 1205534.22 944128.84 1101554.77 128445.59 1240082.66 524326.03 2575986.0
2  ARPC4  40979.78   51904.95  74064.53   38972.67  16760.10   46218.10  60444.73  100100.8
3  KRT17  77261.14  205488.25 819332.98   86556.42  26944.67  509145.45 321247.85  655879.6
4 MRPS36  81783.50  100430.74 129049.67   71059.67  71251.87  313486.79  95901.89  189156.7
5   RBP1  85060.70  381976.65 254617.14  122509.71  80321.20   88639.18 238453.03 5732010.8
6  PRMT1 722479.75  610273.86 419833.22  667370.81 220869.40 1049477.28 688381.30  597083.0

#importing metadata
mc_meta <- read.csv(file.choose(),header = T)

> head(mc_meta) #time "0"=Day0, "1"=Day15, "2"=Day30
  Sample Time Subject Day_replicate
1   B1_0    0      S1           0_1
2   B2_0    0      S2           0_1
3   B3_0    0      S3           0_1
4   B4_0    0      S4           0_1
5   B5_0    0      S5           0_1
6   B6_0    0      S6           0_1

mc_meta1 <- mc_meta %>% mutate_if(is.character, as.factor)%>%mutate_if(is.integer, as.factor)
str(mc_meta1)
'data.frame':   84 obs. of  4 variables:
 $ Sample       : Factor w/ 84 levels "B1_0","B1_15",..: 1 19 22 25 28 31 34 37 40 4 ...
 $ Time         : Factor w/ 3 levels "0","1","2": 1 1 1 1 1 1 1 1 1 1 ...
 $ Subject      : Factor w/ 28 levels "S1","S11","S12",..: 1 11 21 23 24 25 26 27 28 2 ...
 $ Day_replicate: Factor w/ 6 levels "0_1","0_2","15_1",..: 1 1 1 1 1 1 1 1 1 1 ...

mc_mat <- mc %>% remove_rownames() %>% column_to_rownames("Sample")
mc_mat2<-log2(mc_mat)

subjects <- mc_meta1$Subject
Time1 <- mc_meta1$Time

plotMDS(mc_mat2, col=as.numeric(Time1))
legend("topright", legend=c("Day0", "Day15", "Day30"), col=1:3, pch=15)
mc_mat3<-DGEList(mc_mat2)
mc_norm1<-calcNormFactors(mc_mat3)

design_mc<-model.matrix(~0+Time1)

#estimating correlation between repeated fish measurements
corfit1 <- duplicateCorrelation(mc_mat2, design_mc, block = subjects)
corfit1$consensus.correlation
[1] 0.01975354

> colnames(design_mc)
[1] "Time10" "Time11" "Time12"

aw_mc<-arrayWeights(mc_mat2,design_mc)

contrasts<-makeContrasts(Day15vsDay0=Time11-Time10,
                         Day30vsDay0=Time12-Time10,
                         Day30vsDay15=Time12-Time11,
                         levels=colnames(design_mc))

v <- voomWithQualityWeights(mc_norm1, design_mc, plot=TRUE)
fit1<-lmFit(v,design_mc, block = subjects, correlation = corfit1$consensus.correlation)
fit2<-contrasts.fit(fit1,contrasts=contrasts)
efit<-eBayes(fit2)
plotSA(efit)
summary(decideTests(efit))
       Day0vsDay15 Day0vsDay30 Day15vsDay30
Down             0           0            0
NotSig        1547        1544         1547
Up               0           3            0

Thank you! I will try this out again.
Hello again!
The protein intensities are liquid chromatogram intensities. I tried incorporating your suggestions of using cyclic loess normalization and a fixed model instead. Could this code also please be validated?
(I also want to point out that my previous MDS plot was incorrect, as my metadata sample column did not line up correctly with my protein intensity dataset)