Is it possible for the legend labels to be different from the Colcustom names?
1
0
Entering edit mode
@elefthpavlos-21392
Last seen 4 months ago
BRFAA Athens, Greece

Hi,

I am trying to plot a volcano plot using custom colors and I'd like to use legend labels containing subscript e.g. log2.

When I use colCustom argument, legendLabels argument does not work and use of expression function in named vector is not supported.

  1. Do you know if there is a way to replace the names of keyvals by legend labels in order to be able to use the expression function and add subscripts to legend text?
  2. Is it possible to hide/remove the legend completely from the plot?

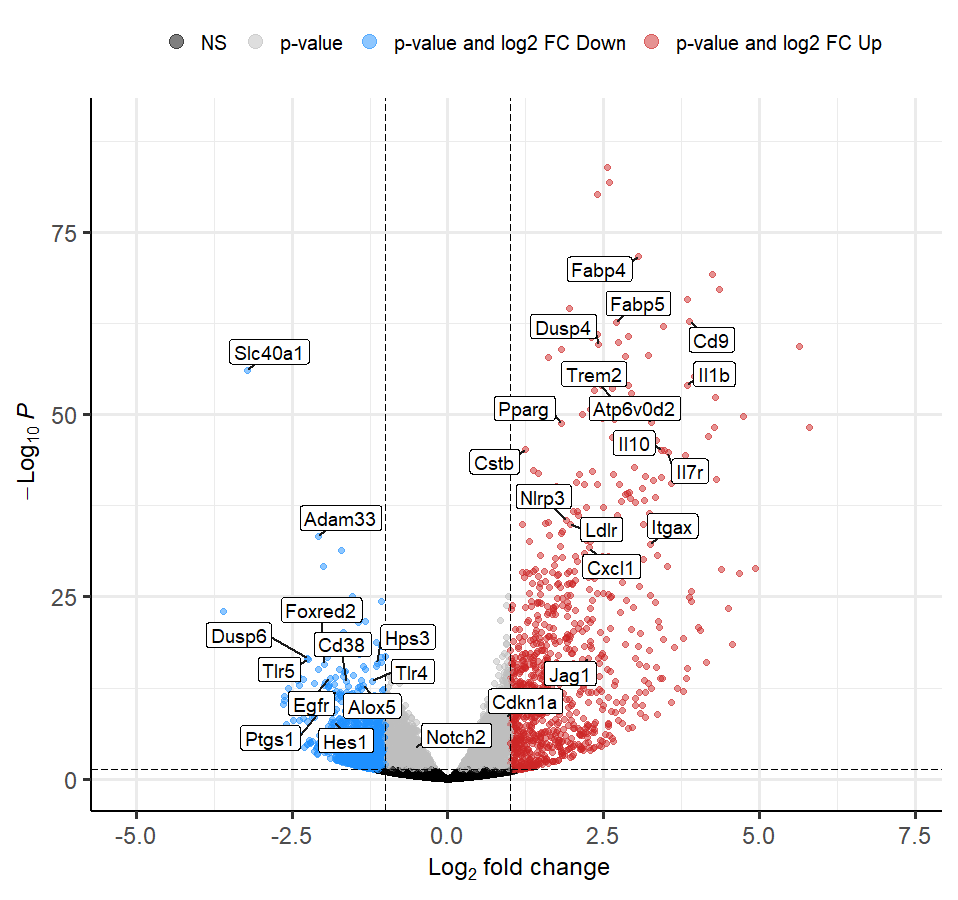
I used the following code to create custom colors and plot:

# create custom key-value pairs for 'high', 'low', 'mid' expression by fold-change
# this can be achieved with nested ifelse statements
keyvals <- ifelse(res$pvalue <= 0.05, 
                  ifelse(res$log2FoldChange < -1, 
                         'dodgerblue',
                         ifelse(res$log2FoldChange > 1, 
                                'firebrick3',
                                'grey')),
                  ifelse(res$log2FoldChange < -1, 
                         'black',
                         ifelse(res$log2FoldChange > 1, 
                                'black',
                                'black'))
)

keyvals[is.na(keyvals)] <- 'grey'
names(keyvals)[keyvals == 'dodgerblue'] <- "p-value and log2 FC Down"
names(keyvals)[keyvals == 'grey'] <- 'p-value'
names(keyvals)[keyvals == 'firebrick3'] <- "p-value and log2 FC Up"
names(keyvals)[keyvals == 'black'] <- "NS" #'low & non sign'
names(keyvals)[keyvals == 'black'] <- "NS" #'mid & non sign'
names(keyvals)[keyvals == 'black'] <- "NS" #'high & non sign'

x = EnhancedVolcano(res,
                    lab = res$Genes,
                    x = 'log2FoldChange',
                    y = 'pvalue',
                    selectLab = genes_to_draw,
                    FCcutoff = 1, 
                    pCutoff = 0.05,
                    colCustom = keyvals,
                    # col = c("yellow", "green", "grey", "firebrick3"), # non-sign/nonFC, non-sign/FC, sign/nonFC, sign/FC
                    drawConnectors = TRUE,
                    arrowheads = FALSE,
                    widthConnectors = 1, 
                    lengthConnectors =  unit(1, "cm"),
                    boxedLabels = TRUE,
                    # legend = c("NS", "p-value", "p-value and log2 FC Down", "p-value and log2 FC Up"),
                    # legendLabels = c('NS', 'p-value', expression(p-value~and~Log[2]~FC), expression(p-value~and~Log[2]~FC)),
                    legendLabSize = 15,
                    title = NULL, subtitle = NULL, caption = NULL)
print(x)

sessionInfo( )
R version 4.1.2 (2021-11-01)
Platform: x86_64-w64-mingw32/x64 (64-bit)
Running under: Windows 10 x64 (build 19043)

Matrix products: default

locale:
[1] LC_COLLATE=Greek_Greece.1253  LC_CTYPE=Greek_Greece.1253    LC_MONETARY=Greek_Greece.1253 LC_NUMERIC=C                  LC_TIME=Greek_Greece.1253    
system code page: 1252

attached base packages:
[1] stats     graphics  grDevices utils     datasets  methods   base     

other attached packages:
[1] EnhancedVolcano_1.12.0 ggrepel_0.9.1          ggplot2_3.3.6         

loaded via a namespace (and not attached):
  [1] ggbeeswarm_0.6.0      colorspace_2.0-3      rjson_0.2.21          deldir_1.0-6          ellipsis_0.3.2        circlize_0.4.15       htmlTable_2.4.1      
  [8] GlobalOptions_0.1.2   base64enc_0.1-3       fs_1.5.2              clue_0.3-61           rstudioapi_0.14       farver_2.1.1          remotes_2.4.2        
 [15] fansi_1.0.3           codetools_0.2-18      splines_4.1.2         extrafont_0.18        doParallel_1.0.17     cachem_1.0.6          knitr_1.40           
 [22] pkgload_1.3.0         Formula_1.2-4         Rttf2pt1_1.3.11       cluster_2.1.2         png_0.1-7             shiny_1.7.2           compiler_4.1.2       
 [29] backports_1.4.1       assertthat_0.2.1      Matrix_1.5-1          fastmap_1.1.0         cli_3.4.1             later_1.3.0           htmltools_0.5.3      
 [36] prettyunits_1.1.1     tools_4.1.2           gtable_0.3.1          glue_1.6.2            dplyr_1.0.10          maps_3.4.0            Rcpp_1.0.9           
 [43] cellranger_1.1.0      vctrs_0.4.2           ggalt_0.4.0           extrafontdb_1.0       iterators_1.0.14      xfun_0.33             stringr_1.4.1        
 [50] ps_1.7.1              openxlsx_4.2.5        mime_0.12             miniUI_0.1.1.1        lifecycle_1.0.3       devtools_2.4.5        MASS_7.3-54          
 [57] scales_1.2.1          promises_1.2.0.1      parallel_4.1.2        proj4_1.0-11          RColorBrewer_1.1-3    ComplexHeatmap_2.13.1 memoise_2.0.1        
 [64] gridExtra_2.3         ggrastr_1.0.1         rpart_4.1-15          latticeExtra_0.6-30   stringi_1.7.8         S4Vectors_0.32.4      corrplot_0.92        
 [71] foreach_1.5.2         checkmate_2.1.0       BiocGenerics_0.40.0   pkgbuild_1.3.1        zip_2.2.1             shape_1.4.6           rlang_1.0.6          
 [78] pkgconfig_2.0.3       matrixStats_0.62.0    lattice_0.20-45       purrr_0.3.5           labeling_0.4.2        htmlwidgets_1.5.4     processx_3.7.0       
 [85] tidyselect_1.2.0      magrittr_2.0.3        R6_2.5.1              IRanges_2.28.0        generics_0.1.3        Hmisc_4.7-1           profvis_0.3.7        
 [92] DBI_1.1.3             pillar_1.8.1          foreign_0.8-81        withr_2.5.0           survival_3.2-13       nnet_7.3-16           ash_1.0-15           
 [99] tibble_3.1.8          crayon_1.5.2          interp_1.1-3          KernSmooth_2.23-20    utf8_1.2.2            urlchecker_1.0.1      jpeg_0.1-9           
[106] GetoptLong_1.0.5      usethis_2.1.6         grid_4.1.2            readxl_1.4.1          data.table_1.14.4     callr_3.7.2           digest_0.6.29        
[113] xtable_1.8-4          httpuv_1.6.6          stats4_4.1.2          munsell_0.5.0         beeswarm_0.4.0        vipor_0.4.5           sessioninfo_1.2.2

enter image description here

EnhancedVolcano enha • 857 views
ADD COMMENT
0
Entering edit mode
Kevin Blighe ★ 3.9k
@kevin
Last seen 1 day ago
Republic of Ireland

Hey,

That looks like a nice volcano plot.

Firstly, to hide the legend, just use legendPosition = 'none'.

Regarding the other issue, I have tried to be as methodical / comprehensive as possible to cater for every eventuality down which a user may go, and I believe an obscure parameter may help you here: parseLabels. By default, parseLabels = FALSE, but you need to set it to TRUE and then try to pass the new labels as, I believe:

keyvals[is.na(keyvals)] <- 'grey'
names(keyvals)[keyvals == 'dodgerblue'] <- "expression(p-value~and~Log[2]~FC~Down)"
names(keyvals)[keyvals == 'grey'] <- 'p-value'
names(keyvals)[keyvals == 'firebrick3'] <- "expression(p-value~and~Log[2]~FC~Up)"
names(keyvals)[keyvals == 'black'] <- "NS"

, or use:

keyvals[is.na(keyvals)] <- 'grey'
names(keyvals)[keyvals == 'dodgerblue'] <- "p-value and Log[2] FC Down"
names(keyvals)[keyvals == 'grey'] <- 'p-value'
names(keyvals)[keyvals == 'firebrick3'] <- "p-value and Log[2] FC Up"
names(keyvals)[keyvals == 'black'] <- "NS"

   EnhancedVolcano(
     ...
     legend = c("NS", "p-value", "p-value and log2 FC Down", "p-value and log2 FC Up"),
     legendLabels = c('NS', 'p-value', expression(p-value~and~Log[2]~FC~Down), expression(p-value~and~Log[2]~FC~Up)),
     ...)

Kind regards,

Kevin

ADD COMMENT
0
Entering edit mode

Hi,

First of all thank you for the great package and the quick response.

The trick with legendPosition = "none" works fine, you may want to add it in the manual along with the ’top’, ’bottom’, ’left’, ’right’.

As for the parseLabels, I set it to TRUE but when running the EnhancedVolcano function got the following error:

Error in EnhancedVolcano(res, lab = res$Genes, x = "log2FoldChange", y = "pvalue",  : 
  argument 10 matches multiple formal arguments

The modified code used is as follows:

keyvals[is.na(keyvals)] <- 'grey'
names(keyvals)[keyvals == 'dodgerblue'] <- "p-value and Log2 FC Down"
names(keyvals)[keyvals == 'grey'] <- "p-value"
names(keyvals)[keyvals == 'firebrick3'] <- "p-value and Log2 FC Up"

x = EnhancedVolcano(res,
                    lab = res$Genes,
                    x = 'log2FoldChange',
                    y = 'pvalue',
                    selectLab = genes_to_draw,
                    FCcutoff = 0.5, 
                    pCutoff = 0.05,
                    colCustom = keyvals,
                    parseLabels = TRUE,
                    # legendPosition = "none",
                    legend = c("NS", "p-value", "p-value and Log2 FC Down", "p-value and Log2 FC Up"),
                    legendLabels = c("NS", "p-value", expression(p-value~and~Log[2]~FC~Down), expression(p-value~and~Log[2]~FC~Up)),
                    drawConnectors = TRUE,
                    arrowheads = FALSE,
                    widthConnectors = 1, 
                    lengthConnectors =  unit(1, "cm"),
                    boxedLabels = TRUE,
                    title = NULL, subtitle = NULL, caption = NULL)

If I remove the legend argument (the one that caused the error), it works but showing the names(keyvals) as legendLabels.

enter image description here

Same behavior with the first option

keyvals[is.na(keyvals)] <- 'grey'
names(keyvals)[keyvals == 'dodgerblue'] <- "expression(p-value~and~Log[2]~FC~Down)"
names(keyvals)[keyvals == 'grey'] <- 'p-value'
names(keyvals)[keyvals == 'firebrick3'] <- "expression(p-value~and~Log[2]~FC~Up)"
names(keyvals)[keyvals == 'black'] <- "NS"

enter image description here

Any ideas?

ADD REPLY

Login before adding your answer.

Traffic: 787 users visited in the last hour
Help About
FAQ
Access RSS
API
Stats

Use of this site constitutes acceptance of our User Agreement and Privacy Policy.

Powered by the version 2.3.6