
Since I'm analyzing my SLAM-seq data for the first time, I thought I'd follow this guide: https://bioconductor.org/packages/devel/bioc/vignettes/DESeq2/inst/doc/DESeq2.html#quick-start
In the guide, it says to use contrast (or name) because contrast sets the log fold change to 0. I have two conditions treatment and control. And for my dds$condition, I releveled it so that the ref = "control". I looked at my plots after using apeglm and ashr to shrink my results, but my plots seem shifted up and the threshold (>2 fold change) looks curved (why??)
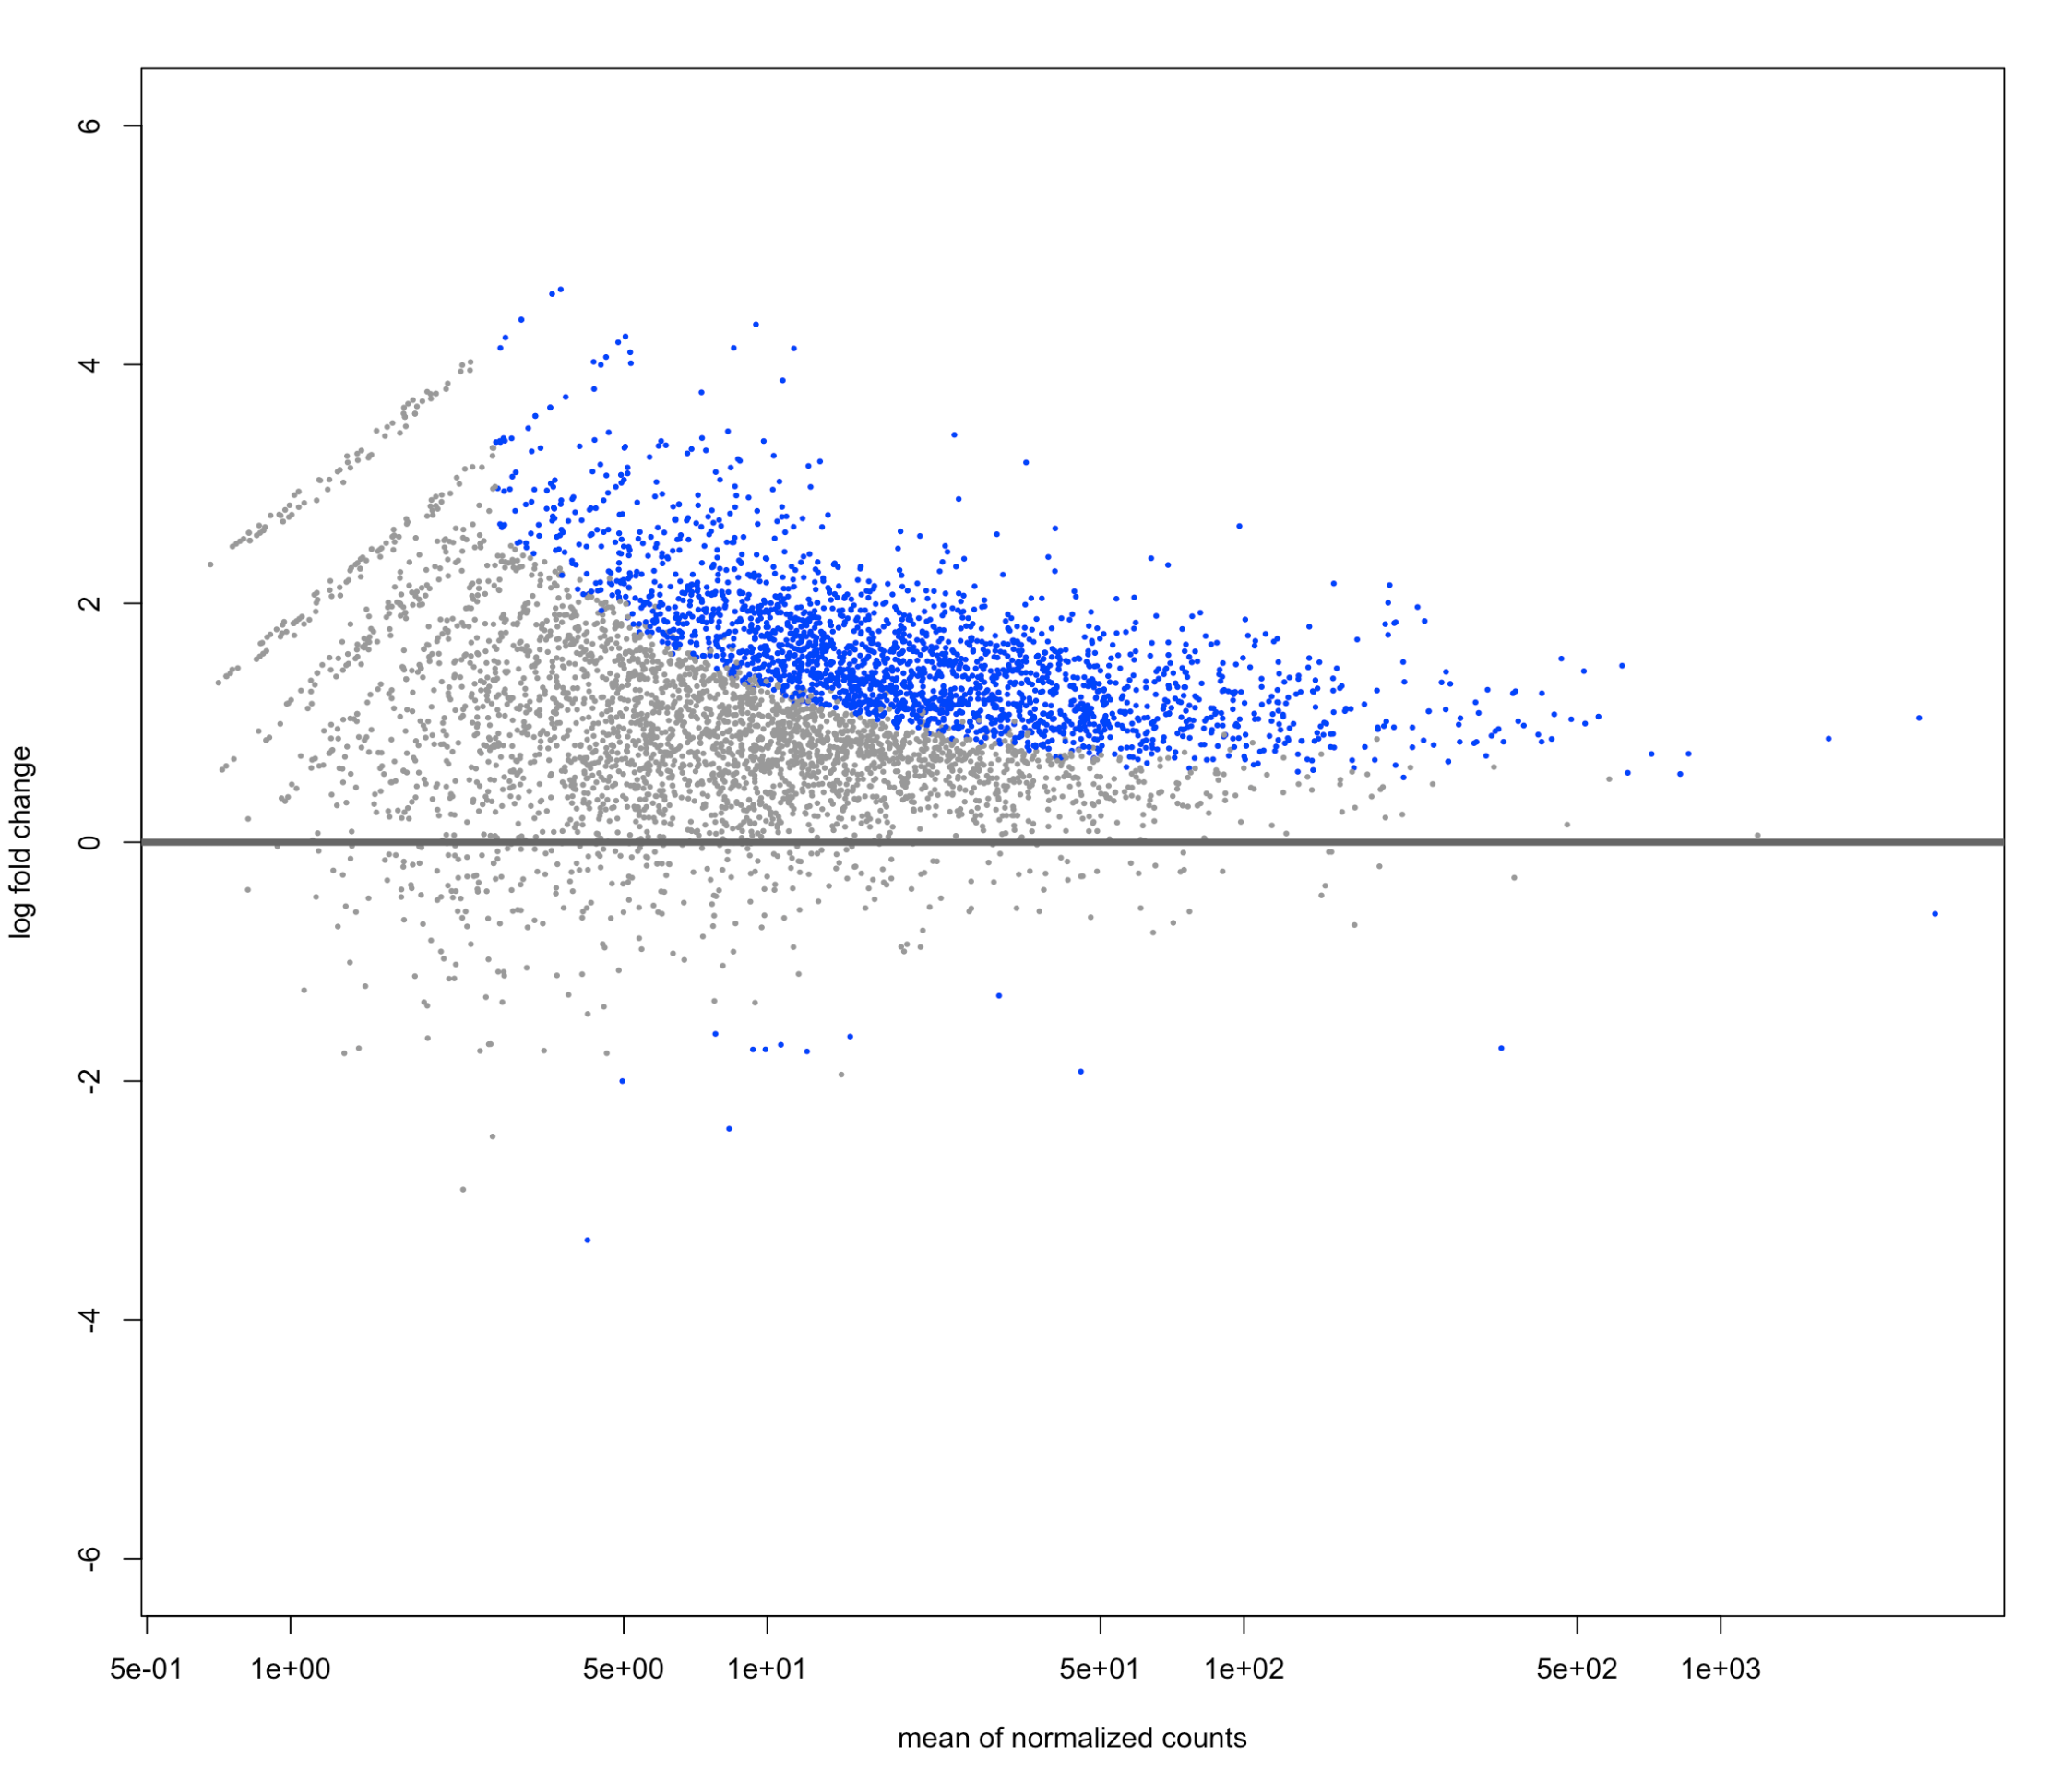
Here is my unshrunken plot I made using plotMA(res, ylim=c(-6,6))
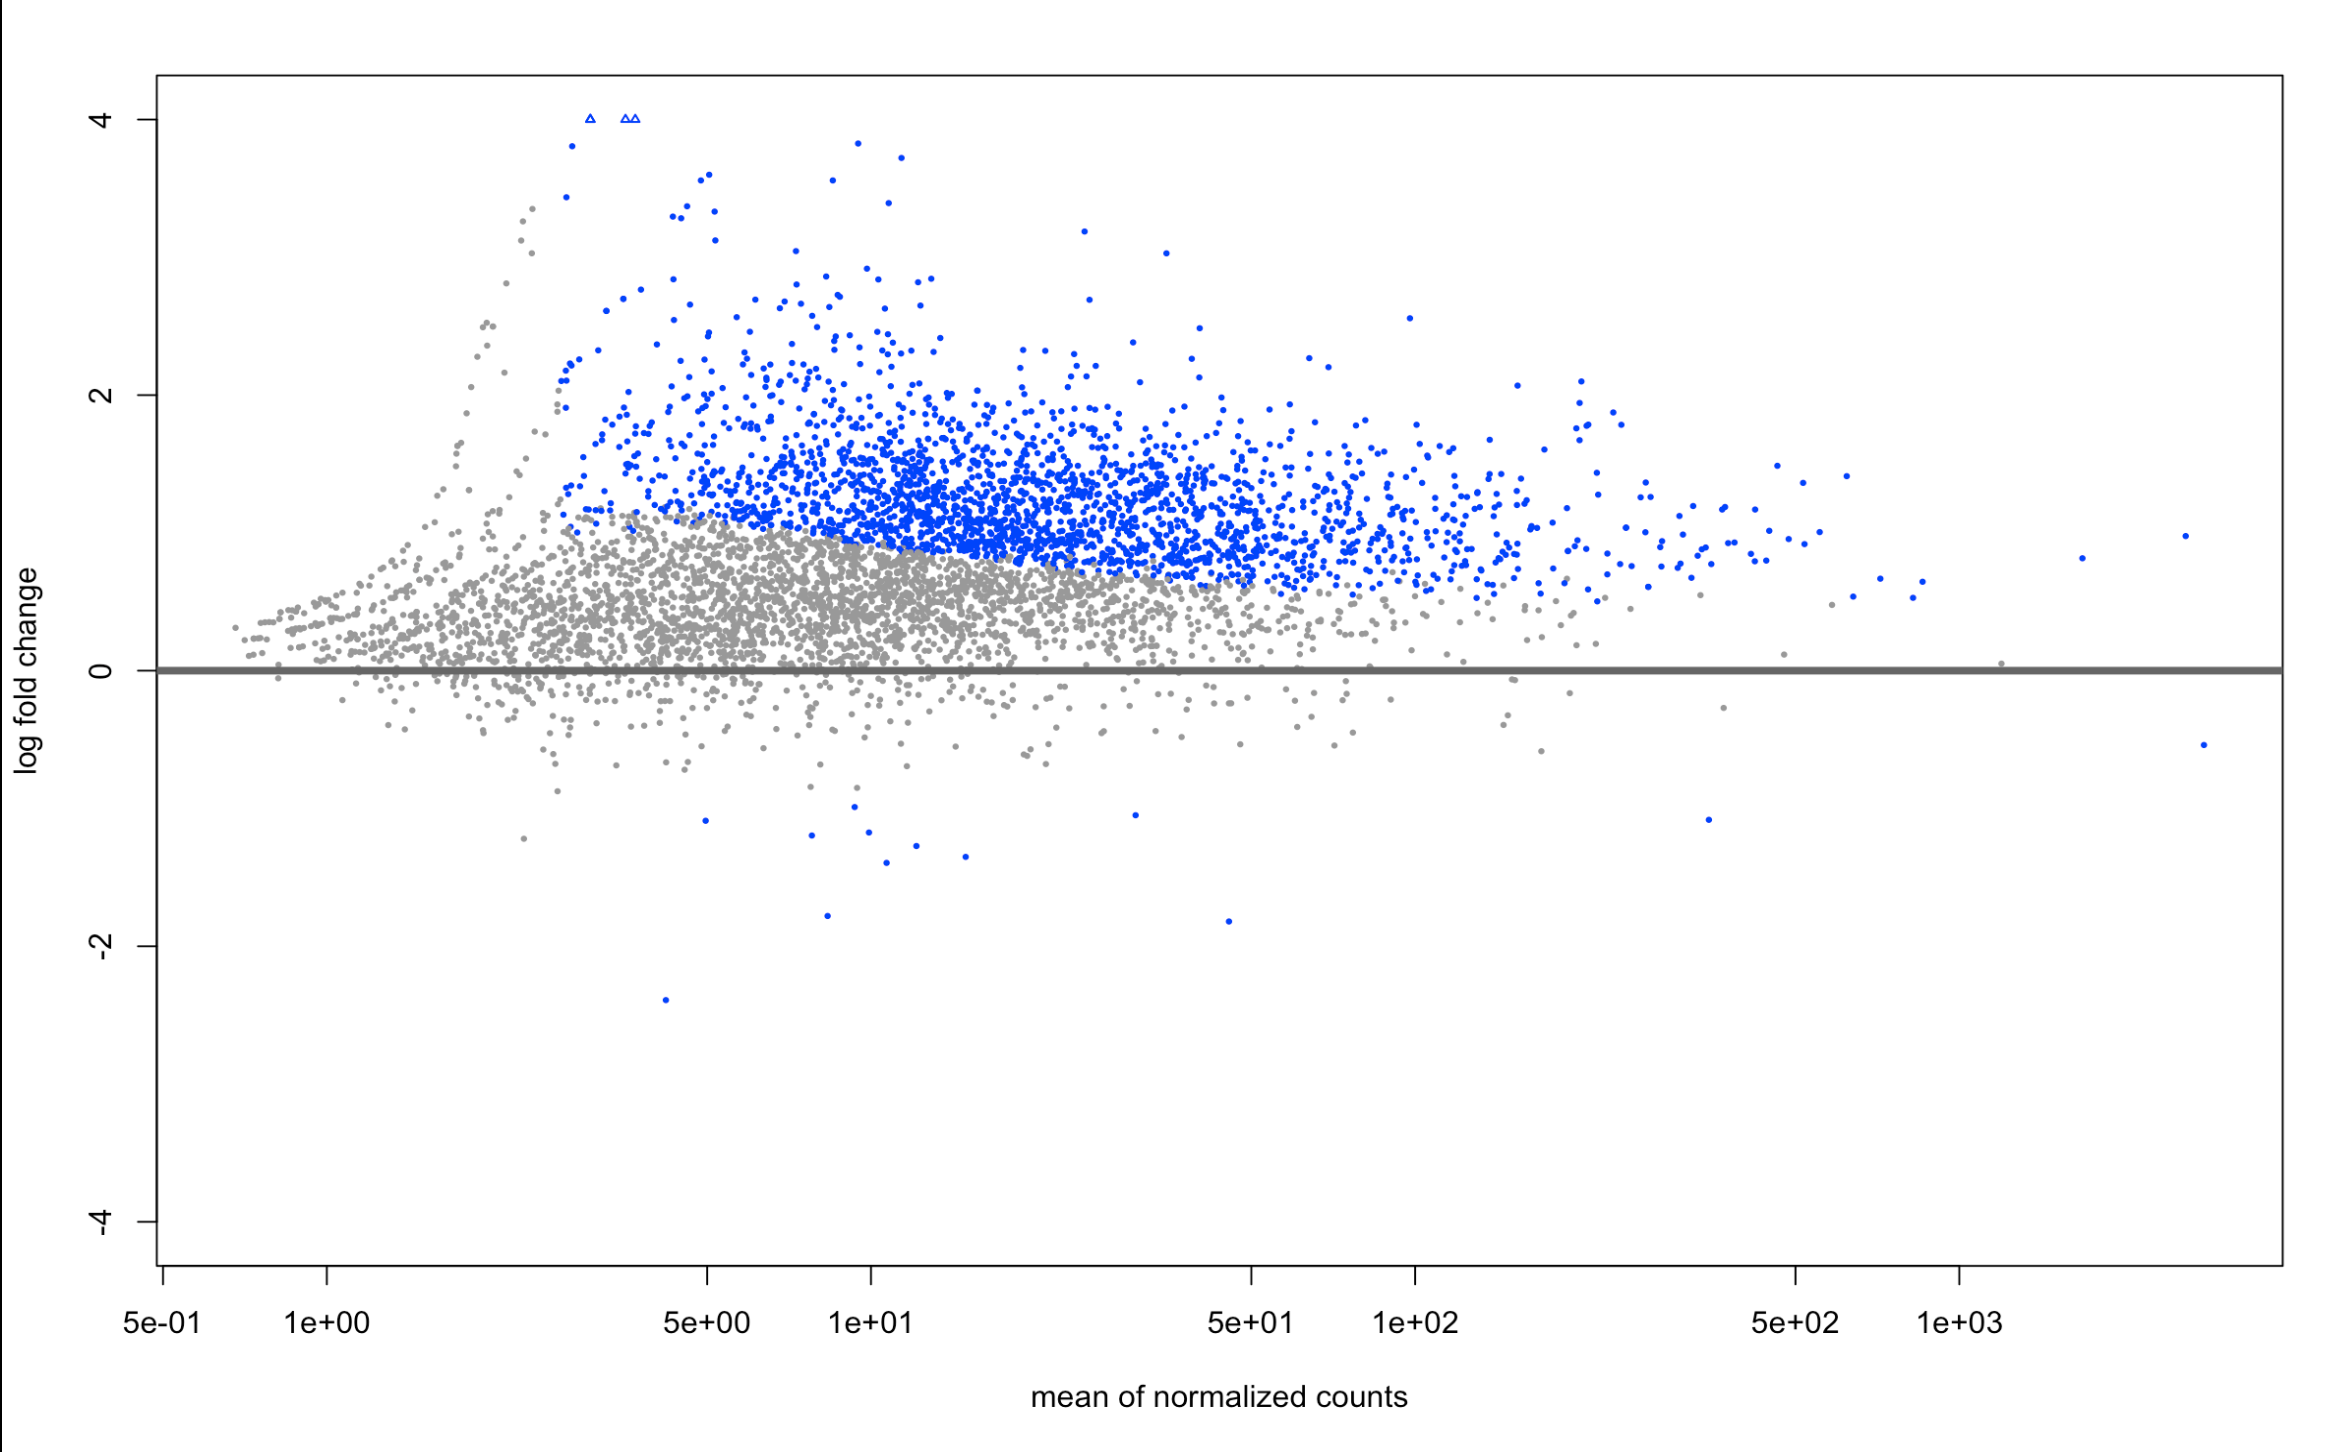
And here are the LFCshrink plots:
plotMA(resLFC, ylim=c(-4,4))
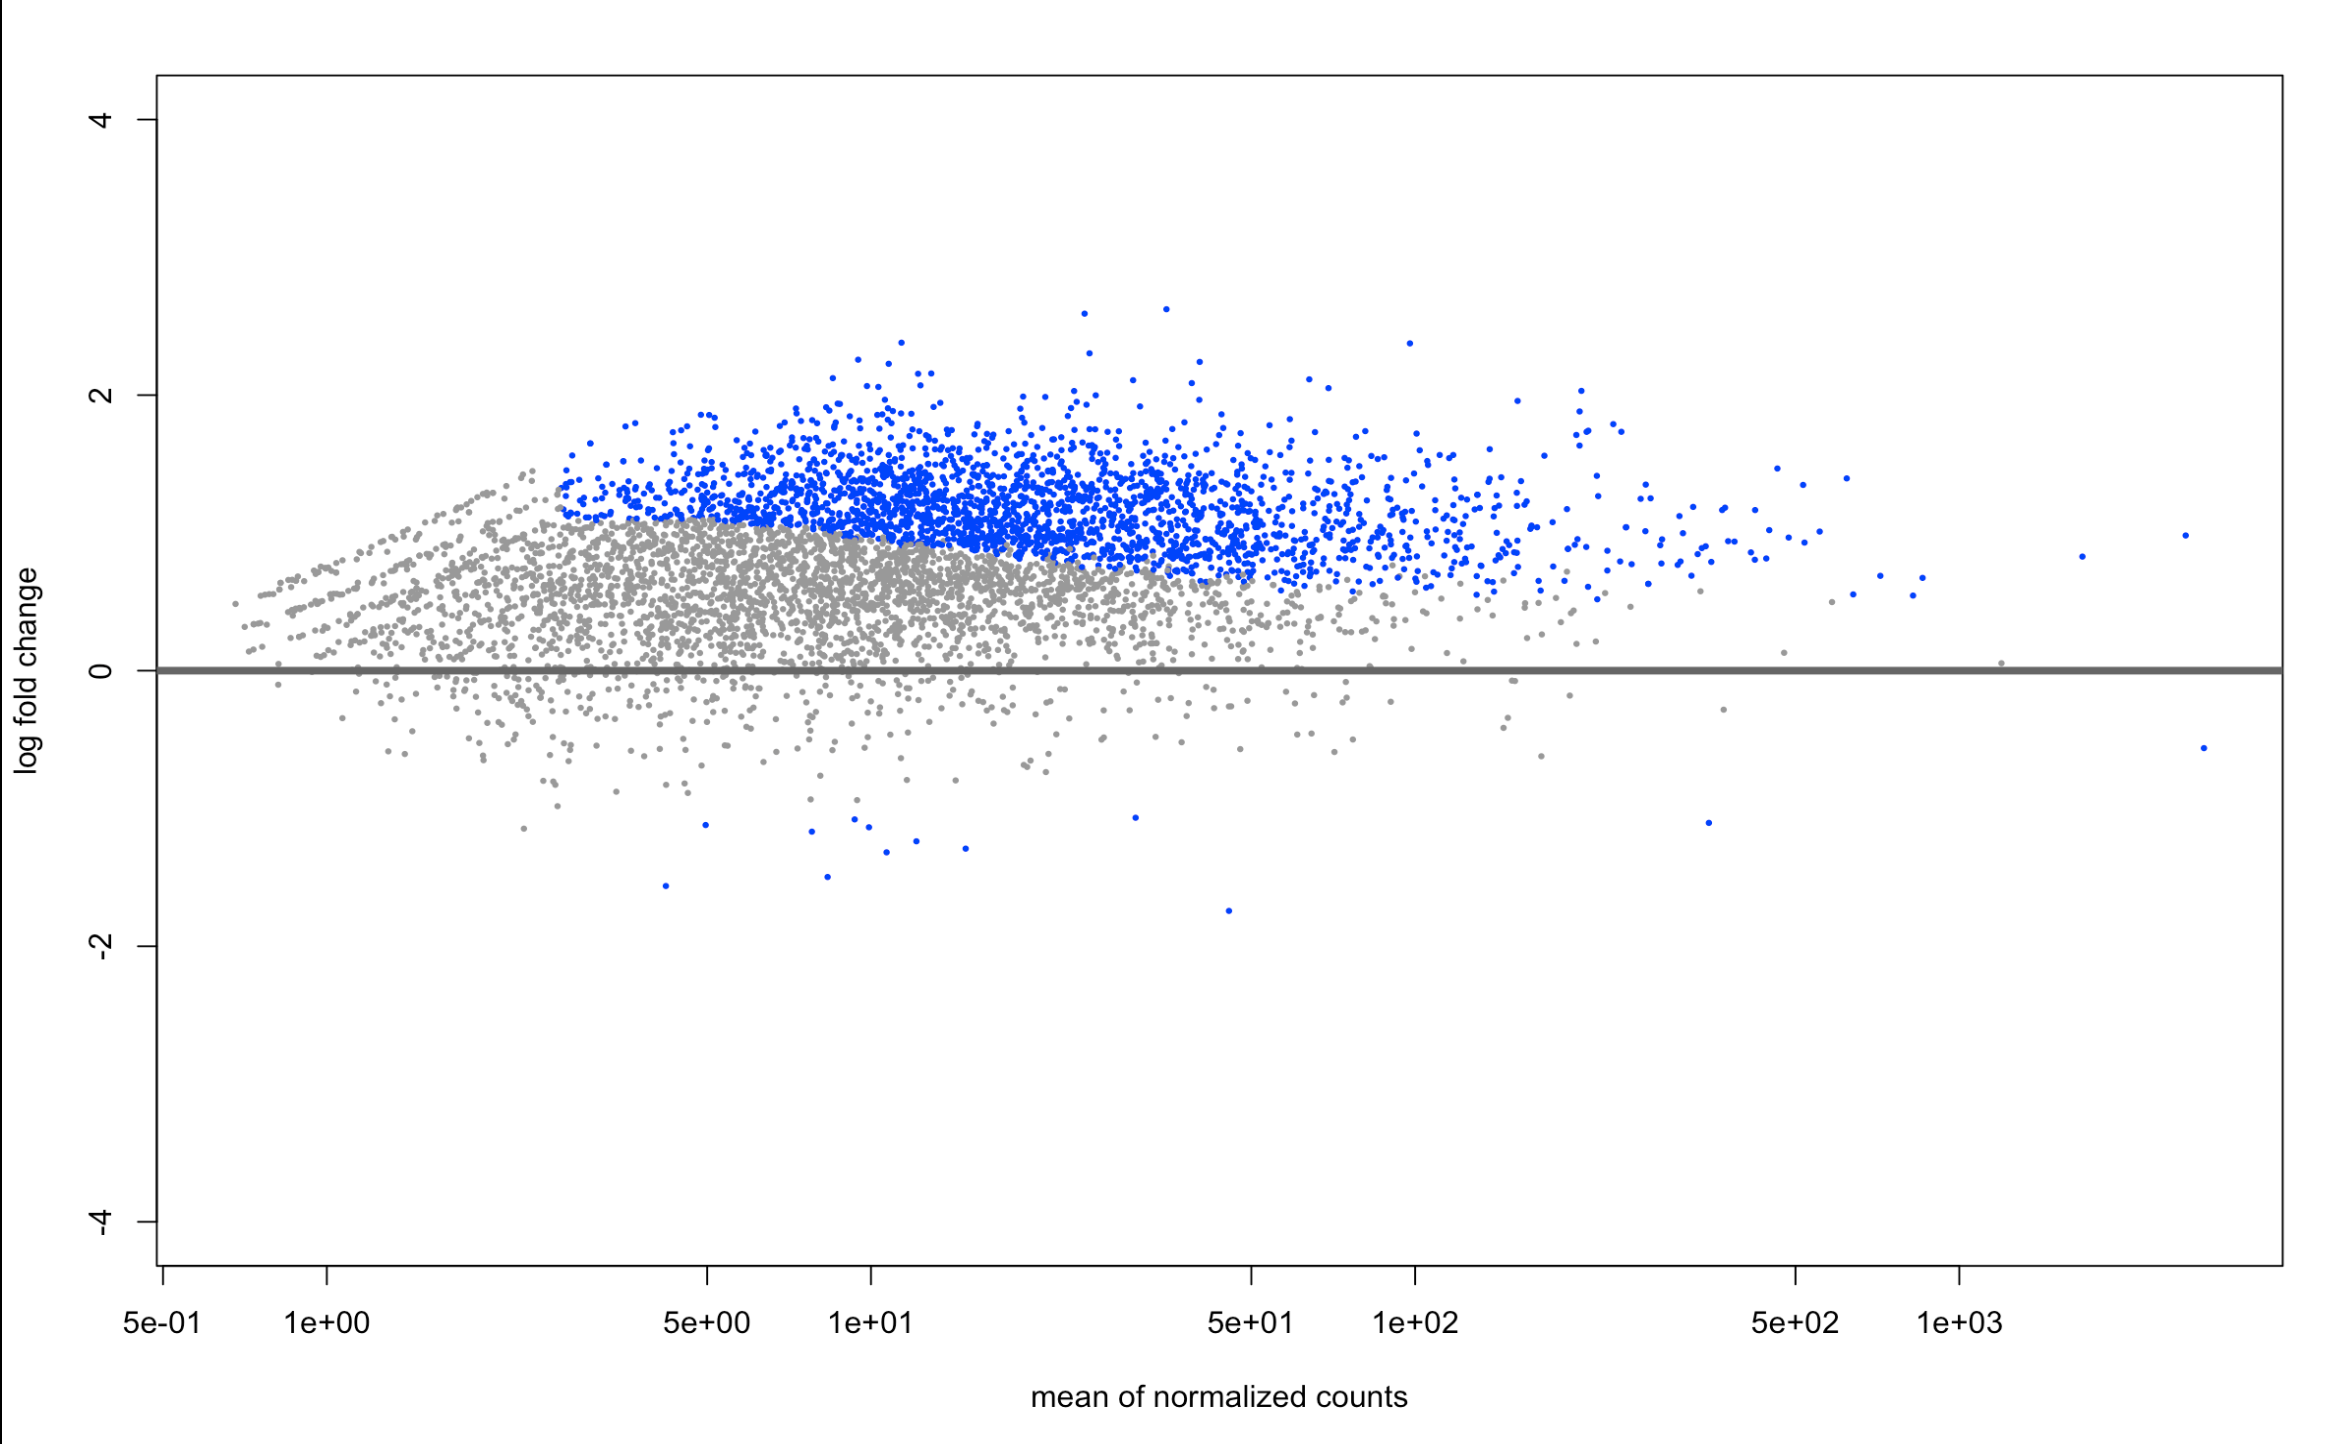
plotMA(resAsh, ylim=c(-4,4))
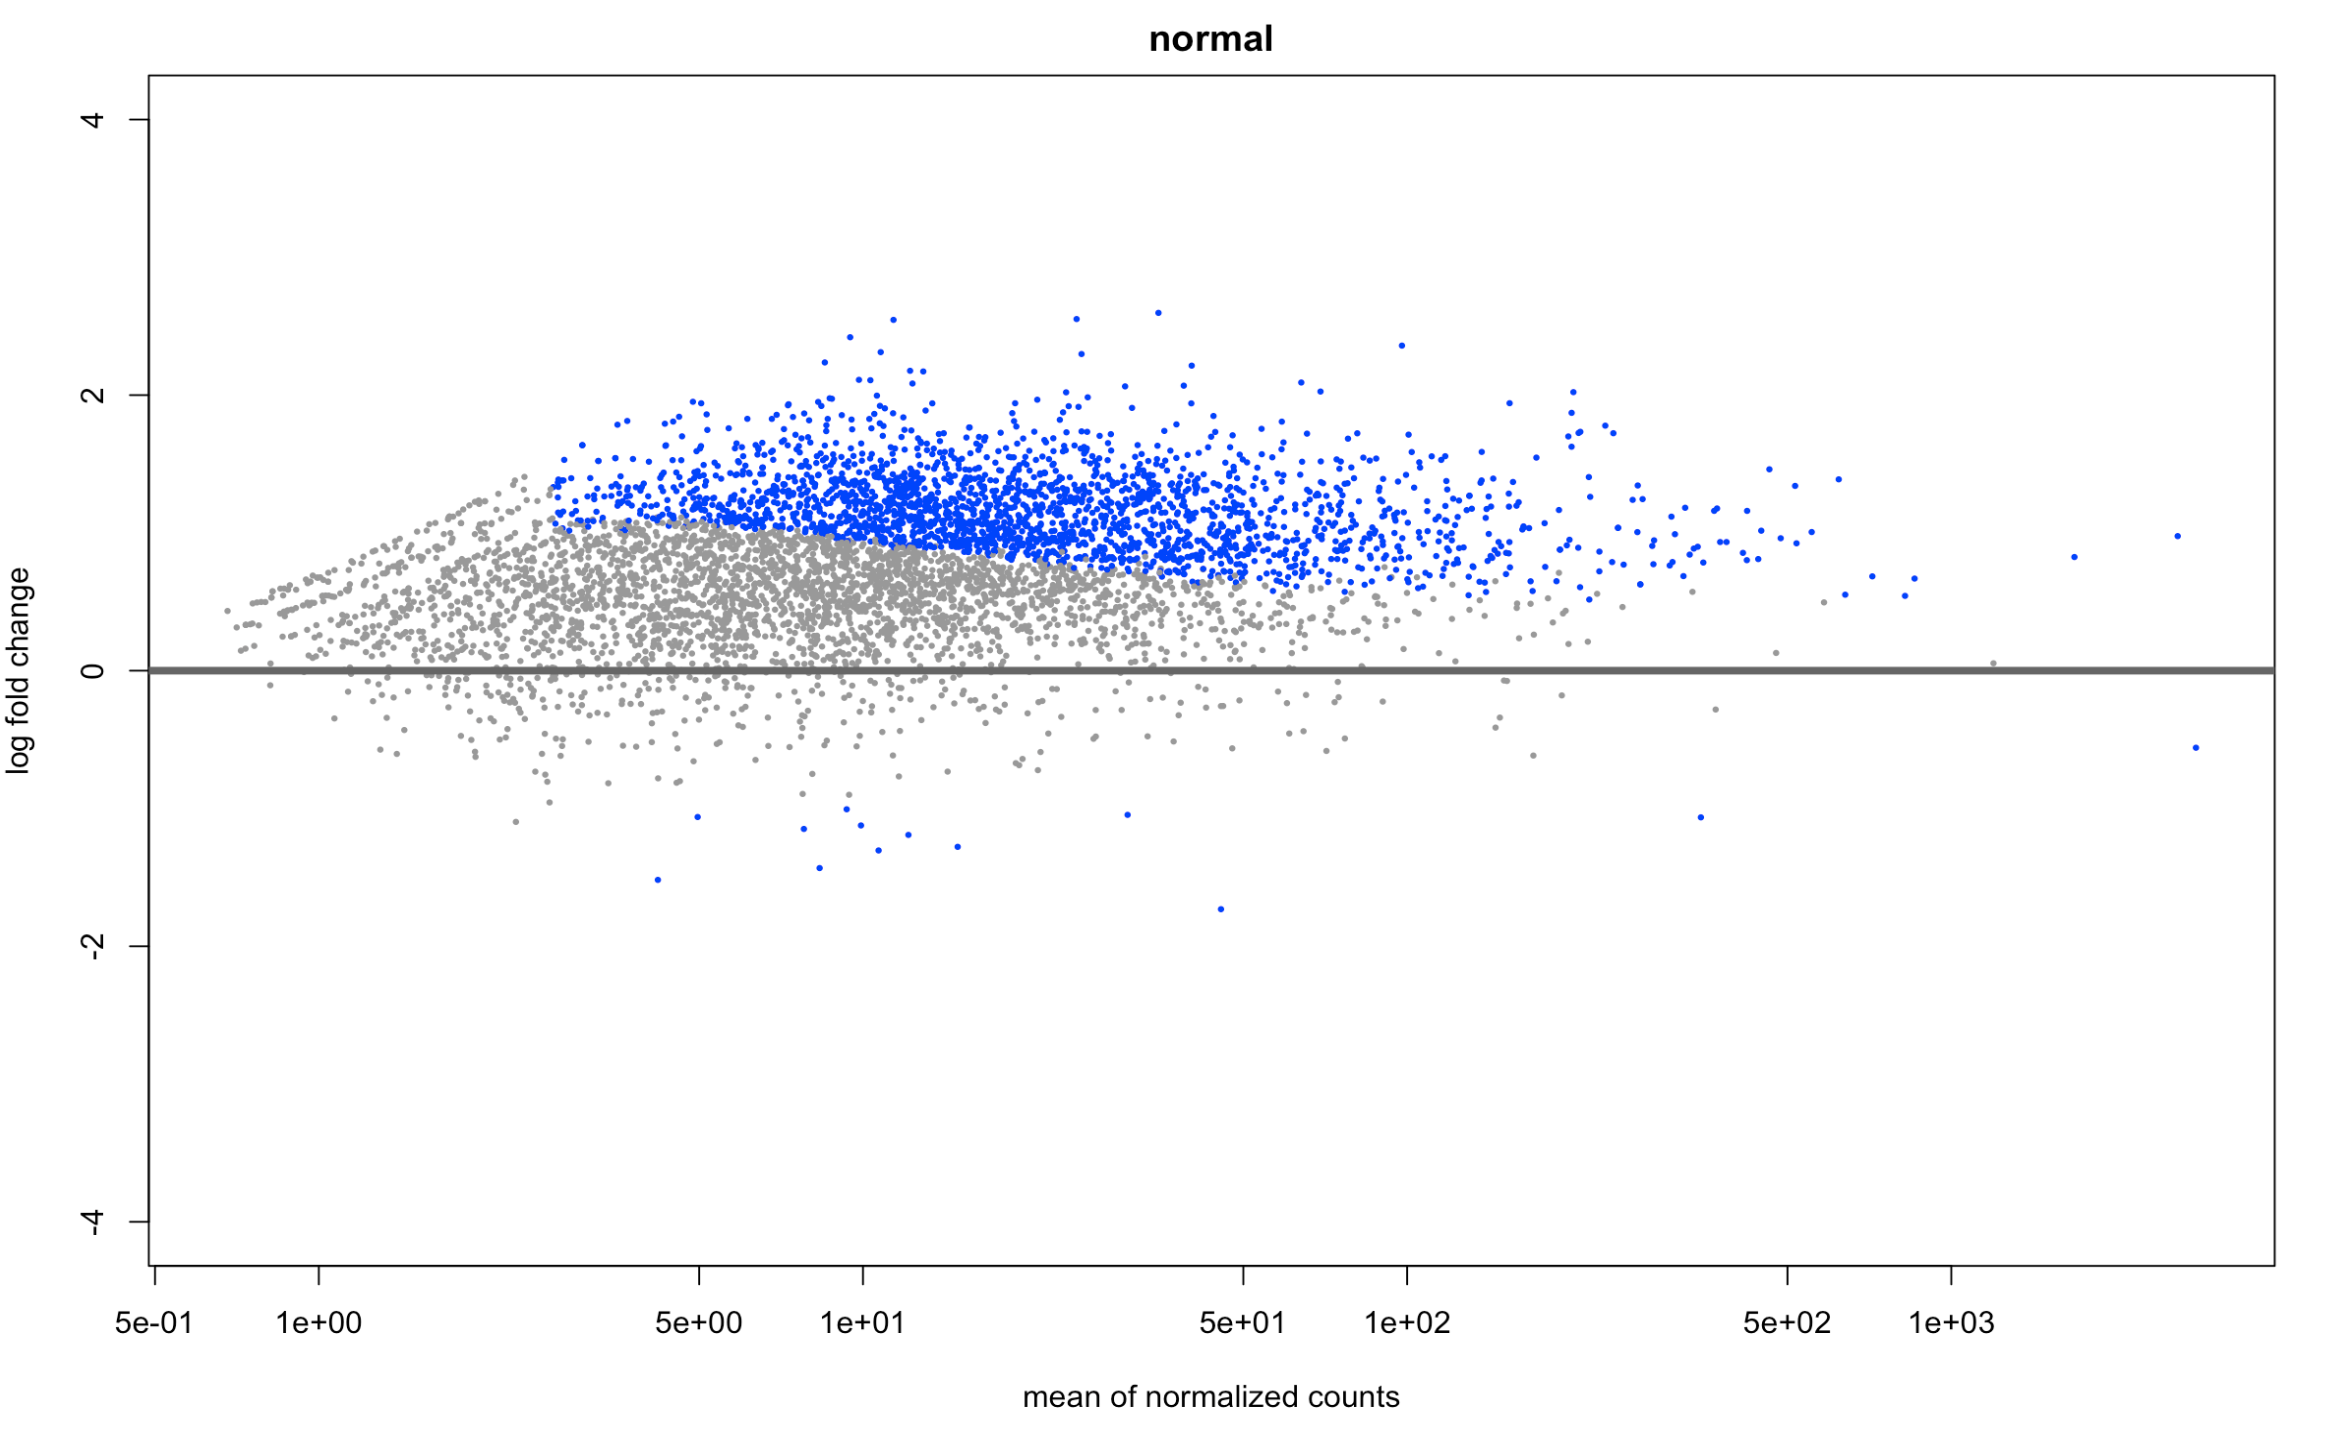
and here is what normal looks like (just for reference) plotMA(resNorm, ylim=c(-4,4), main="normal")
I just asked my PI and they said that there acutally is a massive downregulation across the whole genome, so I'm also unsure why my fold change is in the positive, as though it were flipped. Here is my code:
library("DESeq2")
dds <- DESeqDataSetFromMatrix(countData = my_cts,
                          colData = my_coldata,
                          design = ~ condition)
#prefilter row sums with less than 10 reads
keep <- rowSums(counts(dds)) >= 10
dds <- dds[keep,]
#factor levels
dds$condition <- relevel(dds$condition, ref = "spt15_ctrl")
#deseq
dds <- DESeq(dds)
res <- results(dds) #details about the comparison are printed to the console above the results table (should
say "condition treated vs untreated")
res
#contrast results (to set logfold change to 0)
res <- results(dds, contrast=c("condition","spt15_aa","spt15_ctrl"))
enter code here
#shrink results for better viewing
#lfcShrink(dds = dds, coef = 3, type = "apeglm")
resultsNames(dds)
resLFC <- lfcShrink(dds, coef = 2, type = "apeglm") #coef is set to "condition spt15 aa vs spt15 ctrl"
resNorm <- lfcShrink(dds, coef=2, type="normal")
resAsh <- lfcShrink(dds, coef=2, type="ashr")

it didn't center around 0 on the MA plot (which I'm not familiar with, but seems to be p-value distribution?) but it was for my -log10 p value vs log2fold change plot!