Entering edit mode

Hi everyone,
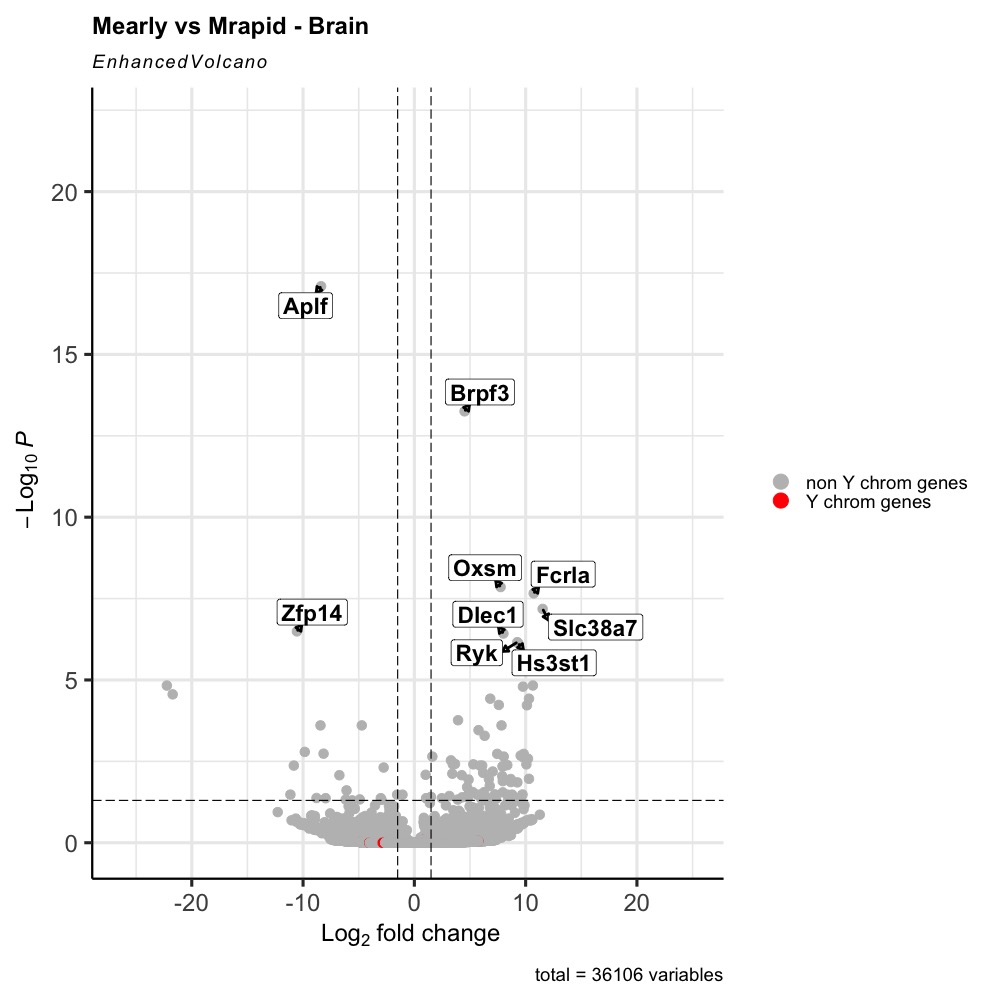
I would like to colour a specific population of genes in a volcano plot using enhanced volcano function. The thing is they are crowded in the rest of the non-significant genes. Would like to overlay them to be visible.
Here is the code used
keyvals.colour <- ifelse(
res_table_tb_sex$ygenes == FALSE, 'grey',
ifelse(res_table_tb_sex$ygenes == TRUE, 'red', 'grey'))
keyvals.colour[is.na(keyvals.colour)] <- 'grey'
names(keyvals.colour)[keyvals.colour == 'red'] <- 'Y chrom genes'
names(keyvals.colour)[keyvals.colour == 'grey'] <- 'non Y chrom genes'

EnhancedVolcano(res_table_tb_sex,
            lab = rownames (res_table_tb_sex),
            x = 'log2FoldChange',
            y = 'padj',
            selectLab = as.character(res_table_tb_sex$genelabels),
            xlab = bquote(~Log[2]~ 'fold change'),
            title = 'Mearly vs Mrapid - Brain',
            pCutoff = 0.05,
            FCcutoff = 1.5,
            pointSize = 3.0,
            labSize = 6.0,
            labCol = 'black',
            labFace = 'bold',
            boxedLabels = TRUE,
            colCustom = keyvals.colour,
            colAlpha = 1, #transparency of the point
            legendLabels=c('NS','Log2FC','padj',
                           'padj & Log2FC'),
            legendPosition = 'right',
            legendLabSize = 14,
            legendIconSize = 5.0,
            drawConnectors = TRUE,
            widthConnectors = 1.0,
            colConnectors = 'black')
Here is the graph obtained. I you see, we can barely see the red dots. I would like that to be on top of the grey ones.
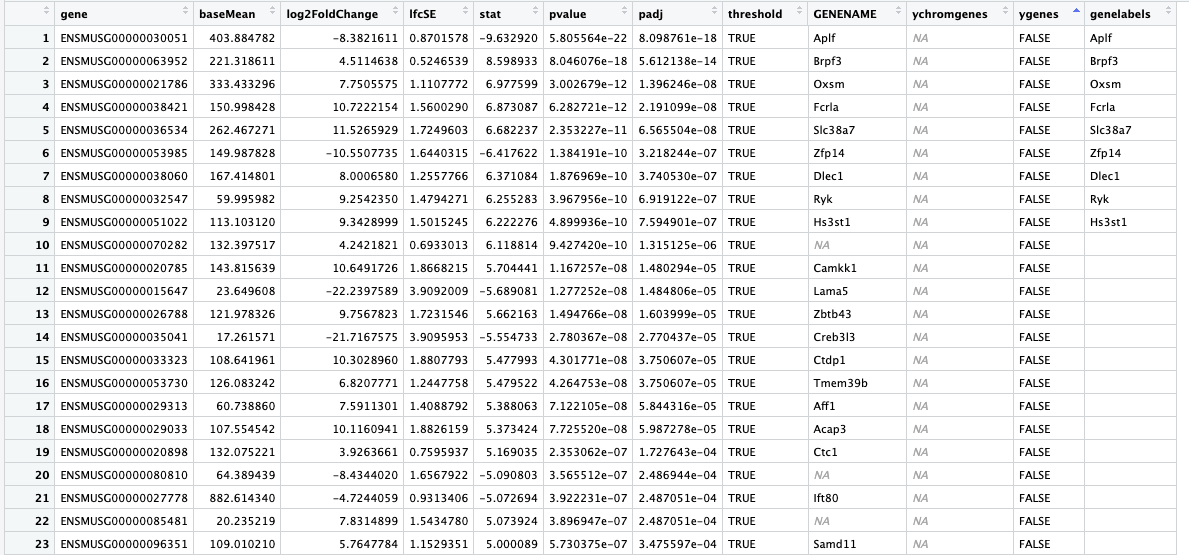
Here is what my data frame looks like (res_table_tb_sex)
Can anyone help me please?

Cross-posted on biostars: https://www.biostars.org/p/9556151/