Which samples to remove from analysis based on Cook's distance outliers plot
1
0
Entering edit mode
Michael • 0
@e828643d
Last seen 7 months ago
United States

Hi, I recently ran DESeq on my samples and wanted to make sure there were no major outliers in my samples. Here, I tried looking at the dispersion plots, correlation matrix, and Cook's distance.

After plotting Cook's distance, three samples stood out. One had a median distance > 1, but the other two had high variance but normal medians. Cook's distance

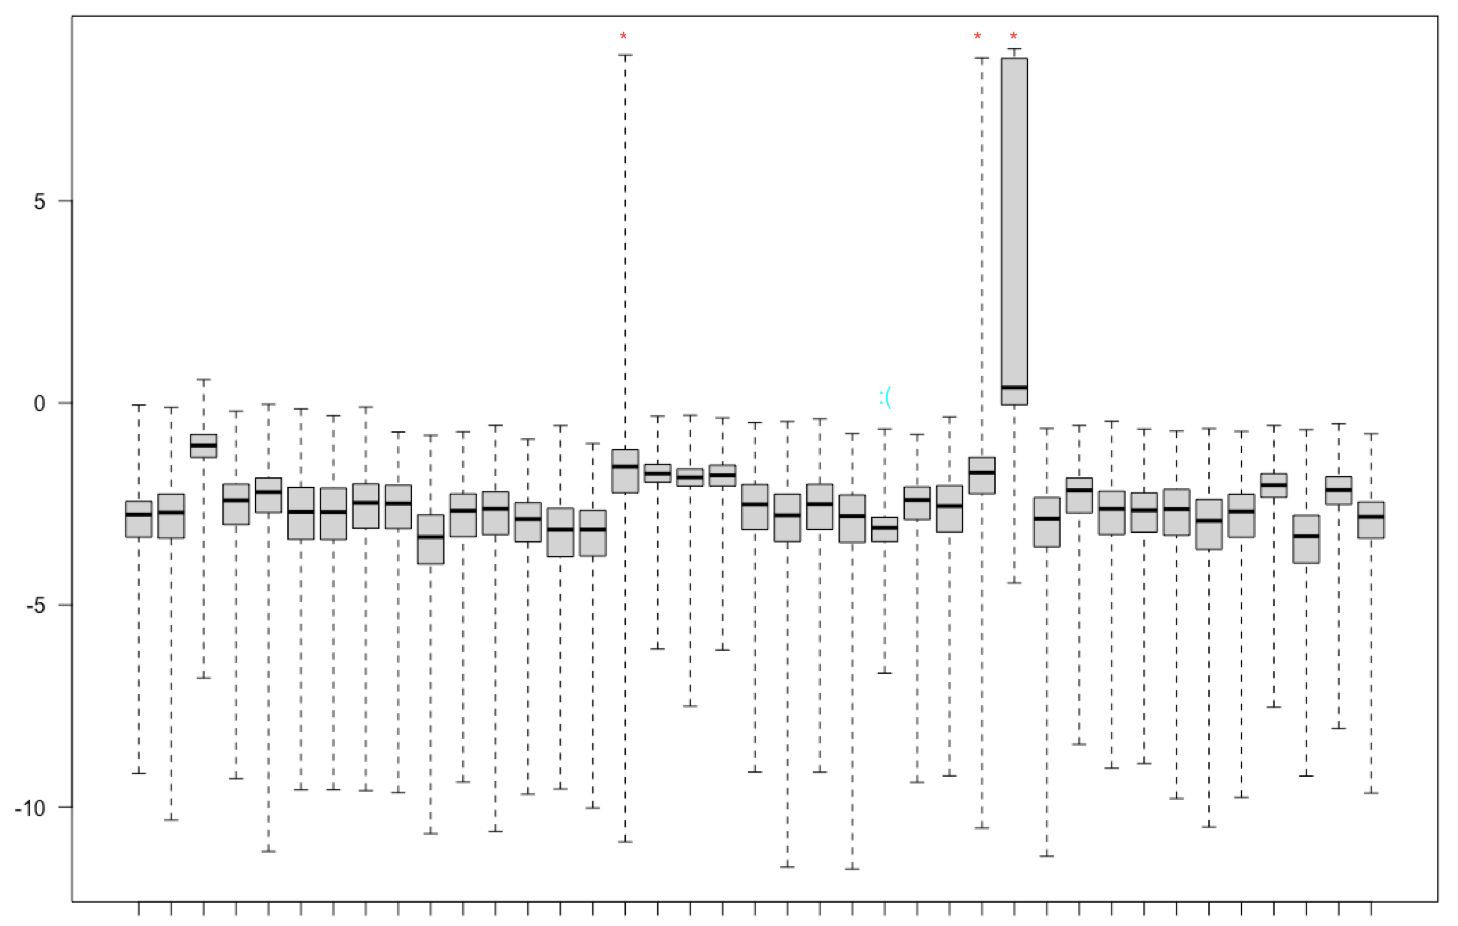
I marked what I thought were outliers in red * but there was a sample that did not correlate well with others marked in cyan. When I remove these four samples from my dataset, my PCA looks like this: PCA plot of all samples and those without the four outliers

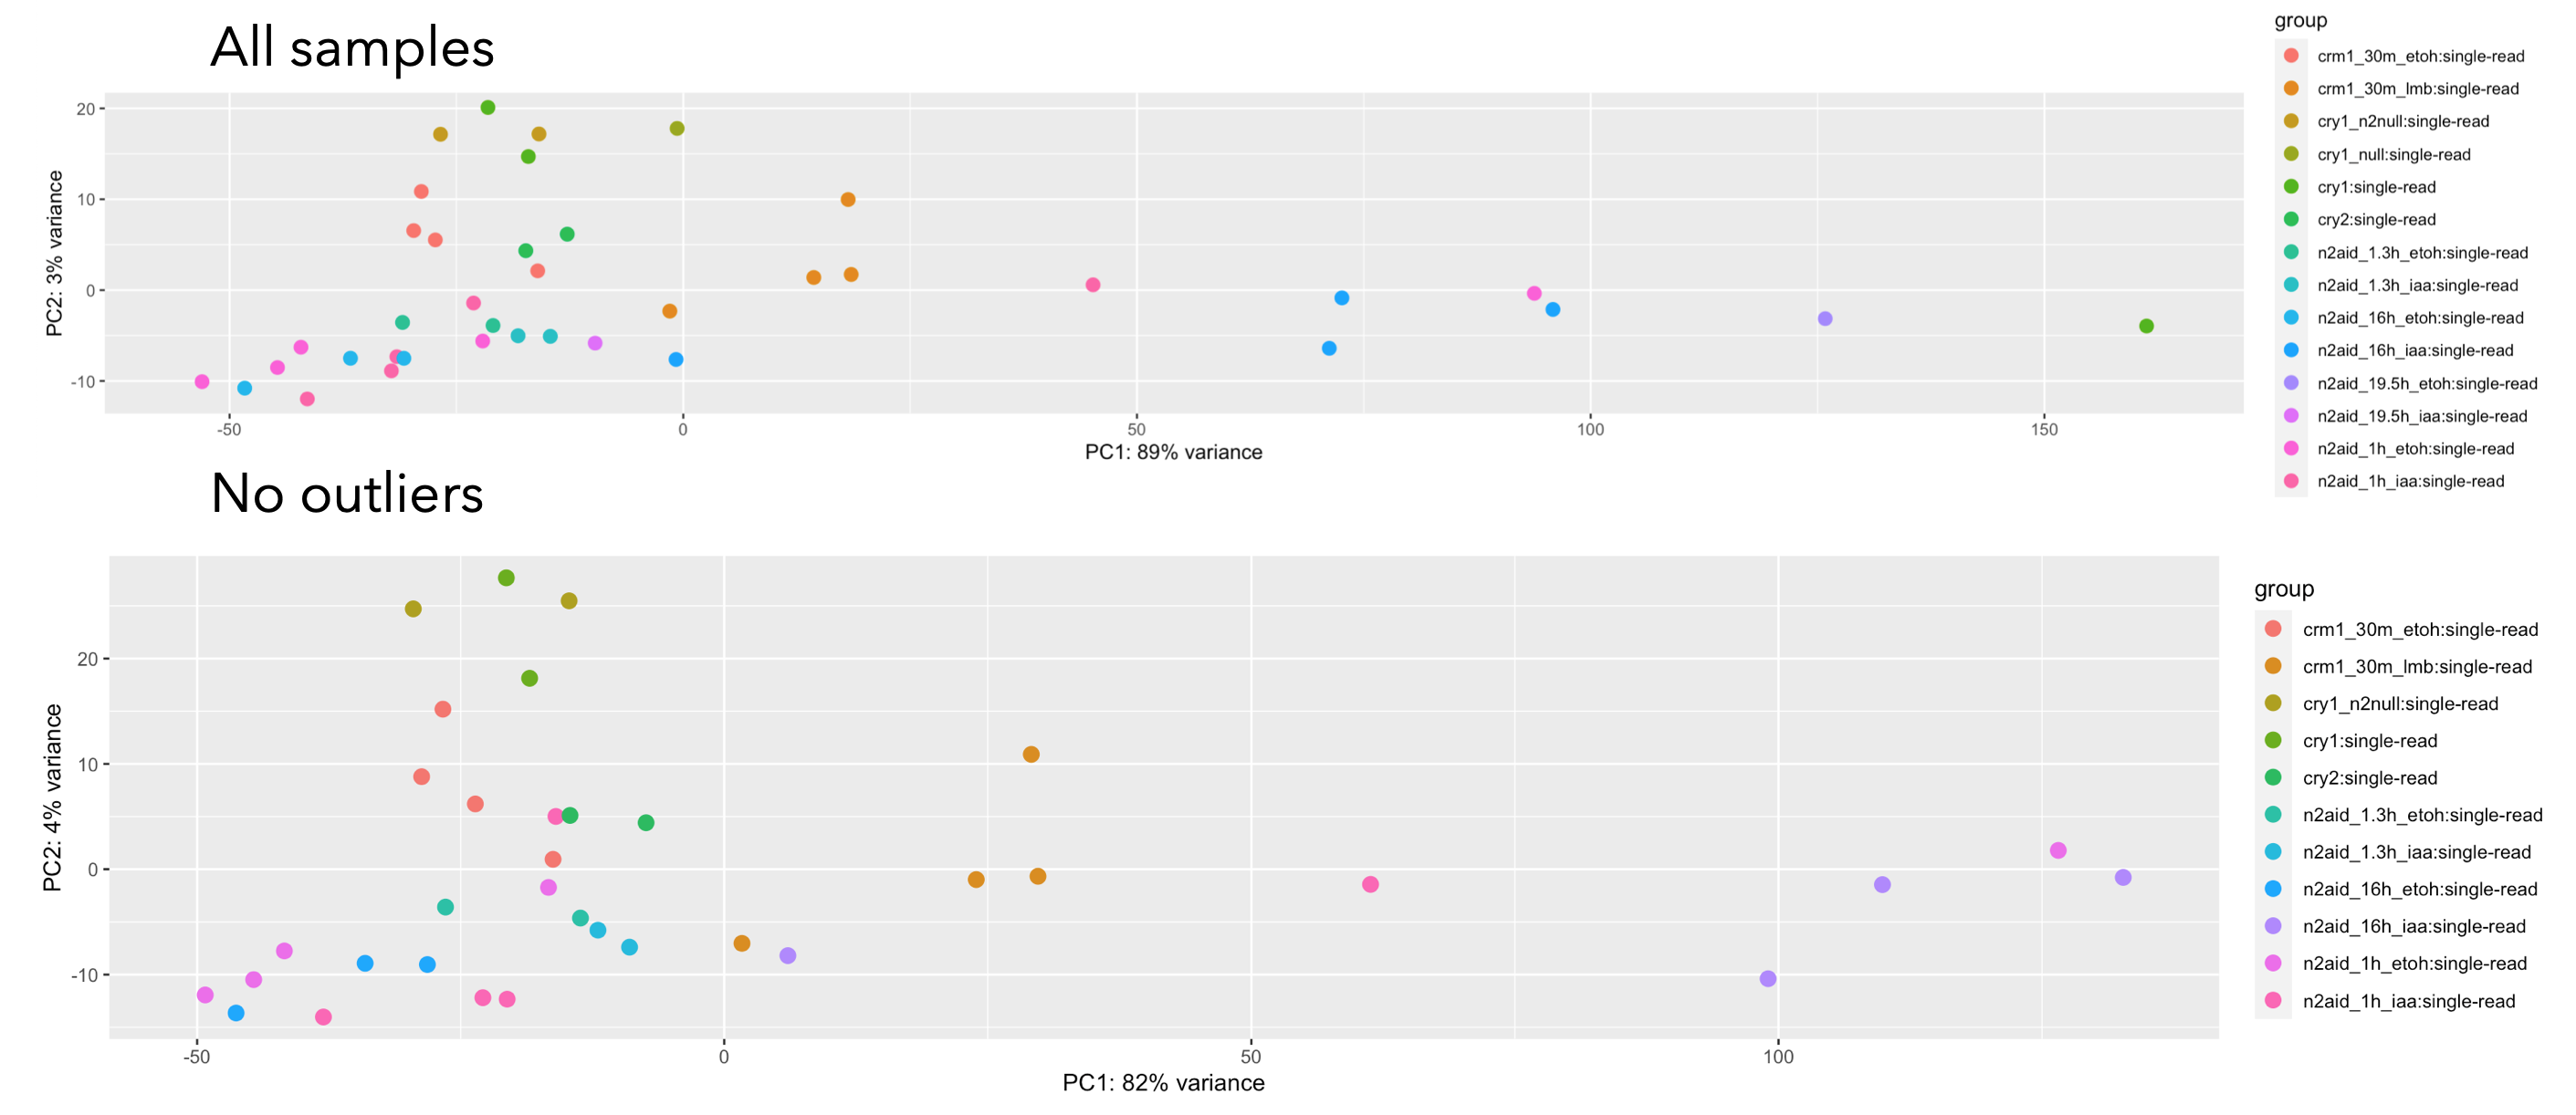
It looks like there's still a lot of variance and I wish I could look at the PCA for one or two samples at a time, but removing the four samples did help the correlation matrix look more clear.

Is this the right way to go about this?

DESeq2 cooks outliers • 615 views
ADD COMMENT
0
Entering edit mode
ATpoint ★ 4.0k
@atpoint-13662
Last seen 10 minutes ago
Germany

The support site is intended for technical problems with the packages. This here is something specific to your data. Try to find out what causes this separation along PC1 which is 82% of total variation. If this is a technical factor try to find out whether it can be removed or whether these samples can or should be removed or whether the analysis should be separated into groups of samples so a technical confounder does not dominate the analysis.

ADD COMMENT

Login before adding your answer.

Traffic: 960 users visited in the last hour
Help About
FAQ
Access RSS
API
Stats

Use of this site constitutes acceptance of our User Agreement and Privacy Policy.

Powered by the version 2.3.6