Add 'ColSideColors' using 'heatmap.2' function
1
0
Entering edit mode
Sooni ▴ 10
@fcaec06f
Last seen 11 months ago
South Korea

Hello.

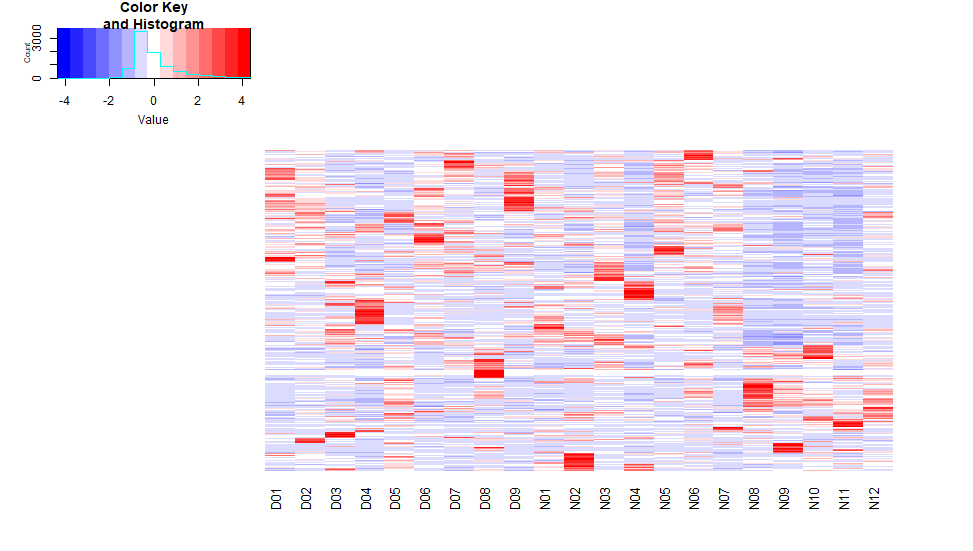
I want to add ColSideColors bar according to rownames.

I want to display D01 to D09 in green and N01 to N12 in red. What should I do?

Here is the heatmap I drew.

enter image description here

ColSideColors heatmaps heatmap.2 • 505 views
ADD COMMENT
1
Entering edit mode
@konstantinos-yeles-8961
Last seen 4 months ago
Italy

Hello Sooni, you haven't provided any code so you just need to put on your data:

xsidecols <- c(rep("#9ACD32", 9), rep("#CD3700", 12))
heatmap(m, ColSideColors = xsidecols)

If you find this answer useful, don't forget to vote it!

ADD COMMENT

Login before adding your answer.

Traffic: 641 users visited in the last hour
Help About
FAQ
Access RSS
API
Stats

Use of this site constitutes acceptance of our User Agreement and Privacy Policy.

Powered by the version 2.3.6