Hi everyone,
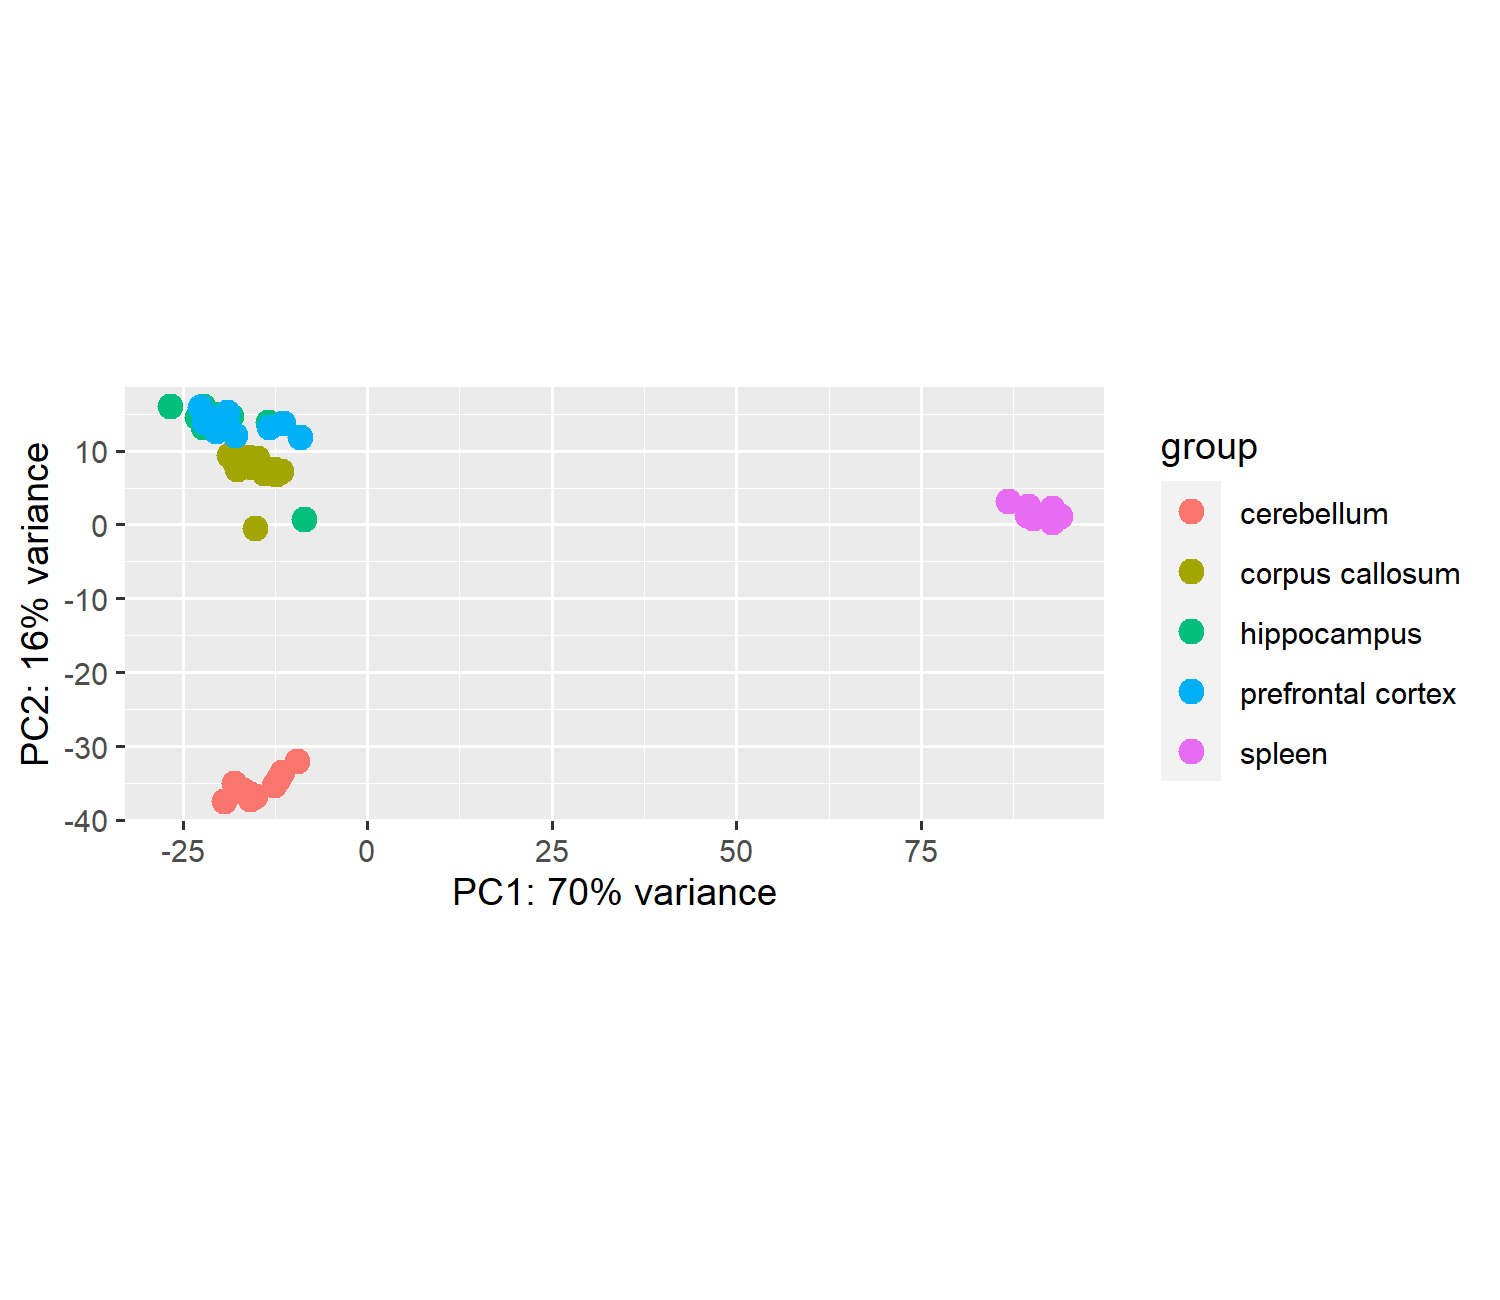
I am using plotPCA() function to create the PCA plot, but I do not know how to change the dot size.
Code as follwing:
plotPCA(rld, intgroup = "Tissue")

Thank you for your help in advance:)
Hi everyone,
I am using plotPCA() function to create the PCA plot, but I do not know how to change the dot size.
Code as follwing:
plotPCA(rld, intgroup = "Tissue")

Thank you for your help in advance:)
It's ggplot2, please search the web for solutions. Alternatively, use return.data (see function help) to fet the data and plot manually and user-defined towards shape, color, size etc.
The function plotPCA() is a function that has been defined to create the PCA plot using ggplot2.
To change the size of the dots in the PCA plot, you can modify the value of the size argument in the geom_point() function. A size argument set to 1 means the dots will be smaller than when it's set for larger values.
plotPCA(rld, intgroup = "Tissue") + geom_point(size=1)
Use of this site constitutes acceptance of our User Agreement and Privacy Policy.
Removed
PCAtoolstag.