Entering edit mode

I am working with RNA counts data. Where the log(counts +1) look like this:
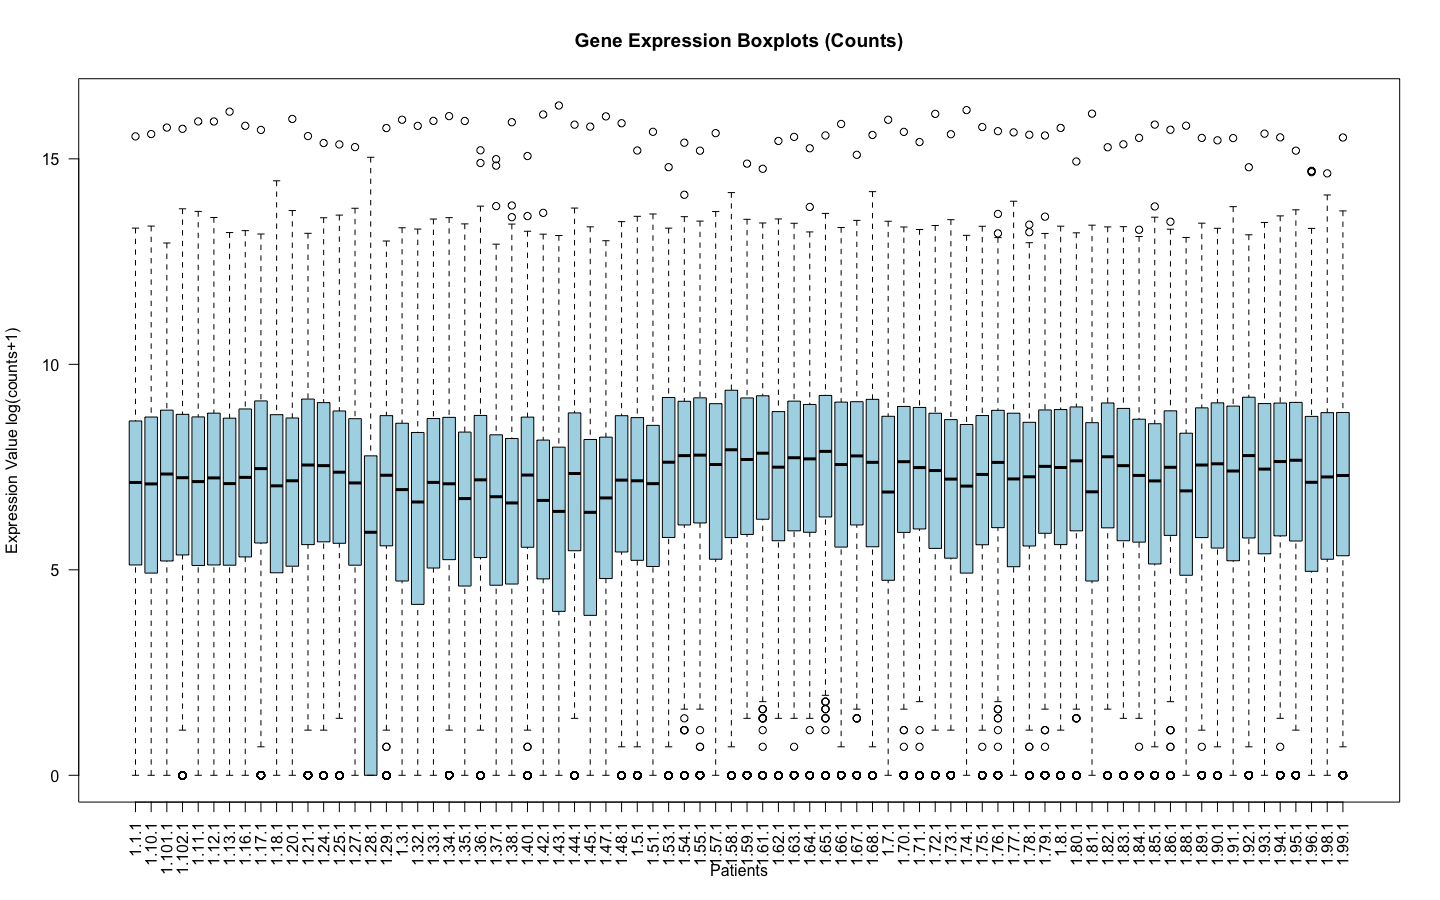
Of course 1.28.1 is an outlier and it was removed before normalization.
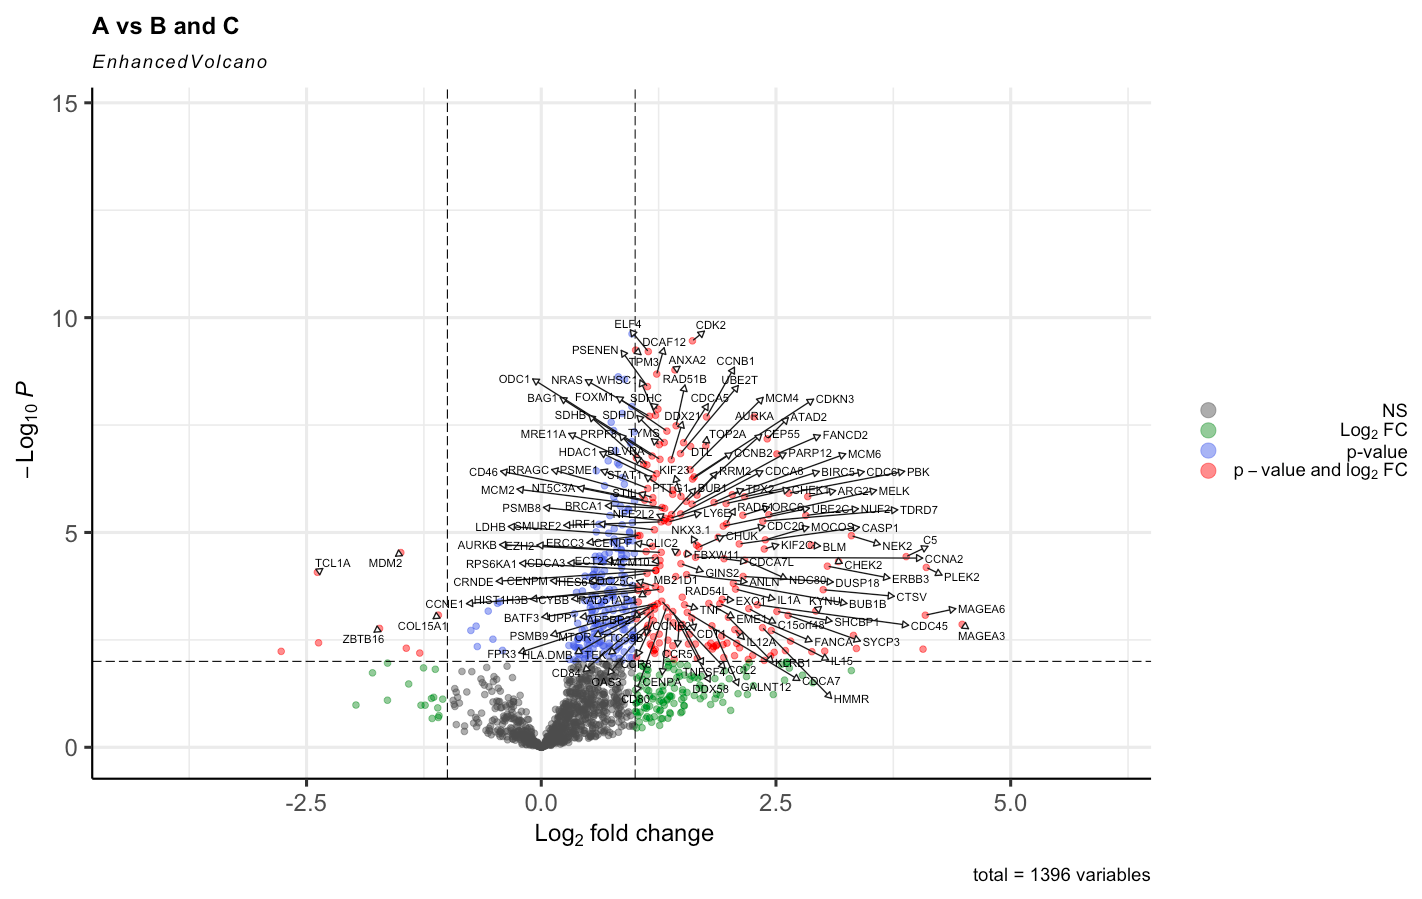
And by doing the right approach with having Voom <- voom(RNA_data, design, plot = TRUE) the results were this, havinng in mind that group A has 50 patients, B 25 and C 25. So the comparison is 50 to 50.
By adding the Voom <- voom(RNA_data, design, plot = TRUE, normalize.method = "quantile") the results changed to this:
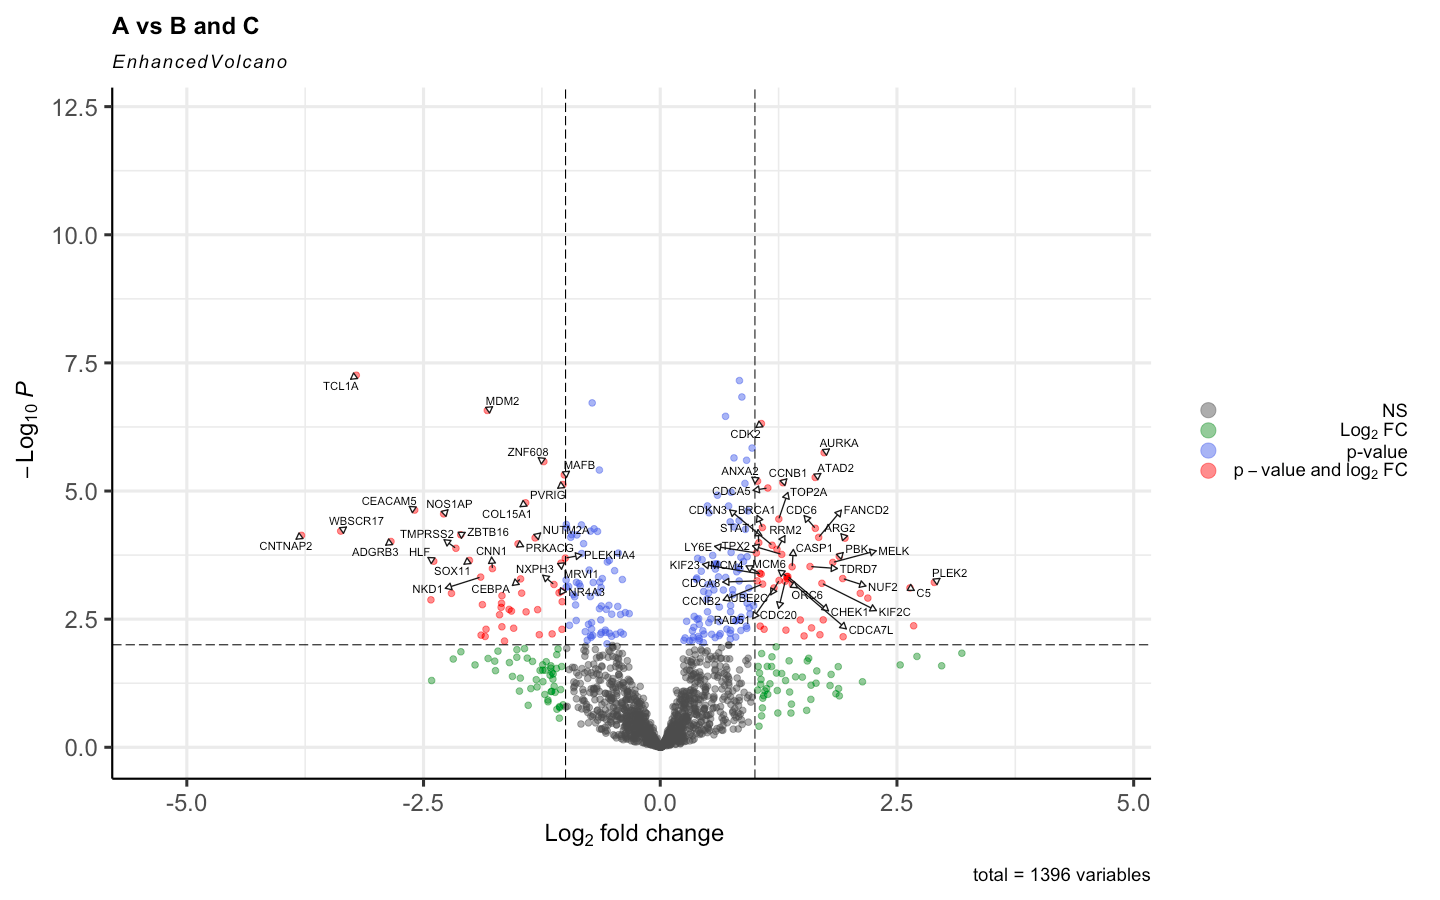
I have read different posts regarding this topic even that normalize.method = "quantile" is used standardly in the original paper of voom. But is it supposed to cause such impact on the results. Given the distribution of the expression is this supposed to happen?

I am sorry, I have edited so that the images are visible, they are the main point of my question. I understand the log(counts+1) was only to remove the outliers before applying voom to make sure that when voom normalizes the data it does not normalize with outliers. And for both cases I filtered the genes in which counts are = 0 and applied edgeR::filterByExpr .
It would be better to use plotMDS to assess outlier samples rather than a plot of log(counts+1). A sample with lower counts might simply have a lower library size but might not be an outlier in terms of expression.
Anyway, yes, normalization is supposed to make a difference. That's why we recommend it! The DE results before normalization look extremely unbalanced and are unlikely to be reliable.
BTW, as I have said before on this forum, I do not recommend logFC cutoffs when assessing DE genes. I understand that it is common practice in the literature, but that doesn't make it good. Making an MD plot (plotMD) will give a better idea of the relationship between logFC and expression level.
One final question regarding this thread. Indeed, plotMDS had different results when comparing to log(counts +1) showing that the outlier wasn't really an outlier.
I did the plotMDS over the rna_counts data directly without normalizing. And this was the result:
Should the group from 1.18 to 1.36 (with five elements) be considered outlier? Additionally should it be removed before tmm + voom with normalize quantile ?
However the plot after rna_data -> tmm normalization and before voom is this one:
Or this way the only outlier is the that was considered before the 1.28.1. This way the plotMDS should be applied after tmm to discover outliers?
Thank you once gain!
A voom workflow that you can follow is shown here: RNA-seq analysis is easy as 1-2-3 with limma, Glimma and edgeR
voomWithQualityWeightsor (more easily) byedgeR::voomLmFitwithsample.weights=TRUE.